2nd Quarter 2021 Investor Presentation
Evolution of Loan Portfolio
Loan Portfolio Waterfall
$ in billions
Full-Year 2020
$0.9
$3.0
($0.4)
First Half 2021
$14.4
$1.8
Originations
/Advances
PPP, net
Branch/
Loan Sales
$12.9
($0.4)
($5.0)
Includes loans sold in connection
with the sale of branches in South
Texas and Colorado
Paydowns/
payoffs &
other
Originations
/Advances
PPP, net
($2.9)
Paydowns/
payoffs &
other
$11.4
Total loans
at 12/31/19
CRE Concentration
12/31/19
293%
6/30/21
211%
$174M
Energy Portfolio $467M
Total loans
at 12/31/20
Includes strategic decision
to exit or reduce exposure
in certain portfolios: non-
core CRE, energy &
indirect lending
Total loans
at 6/30/21
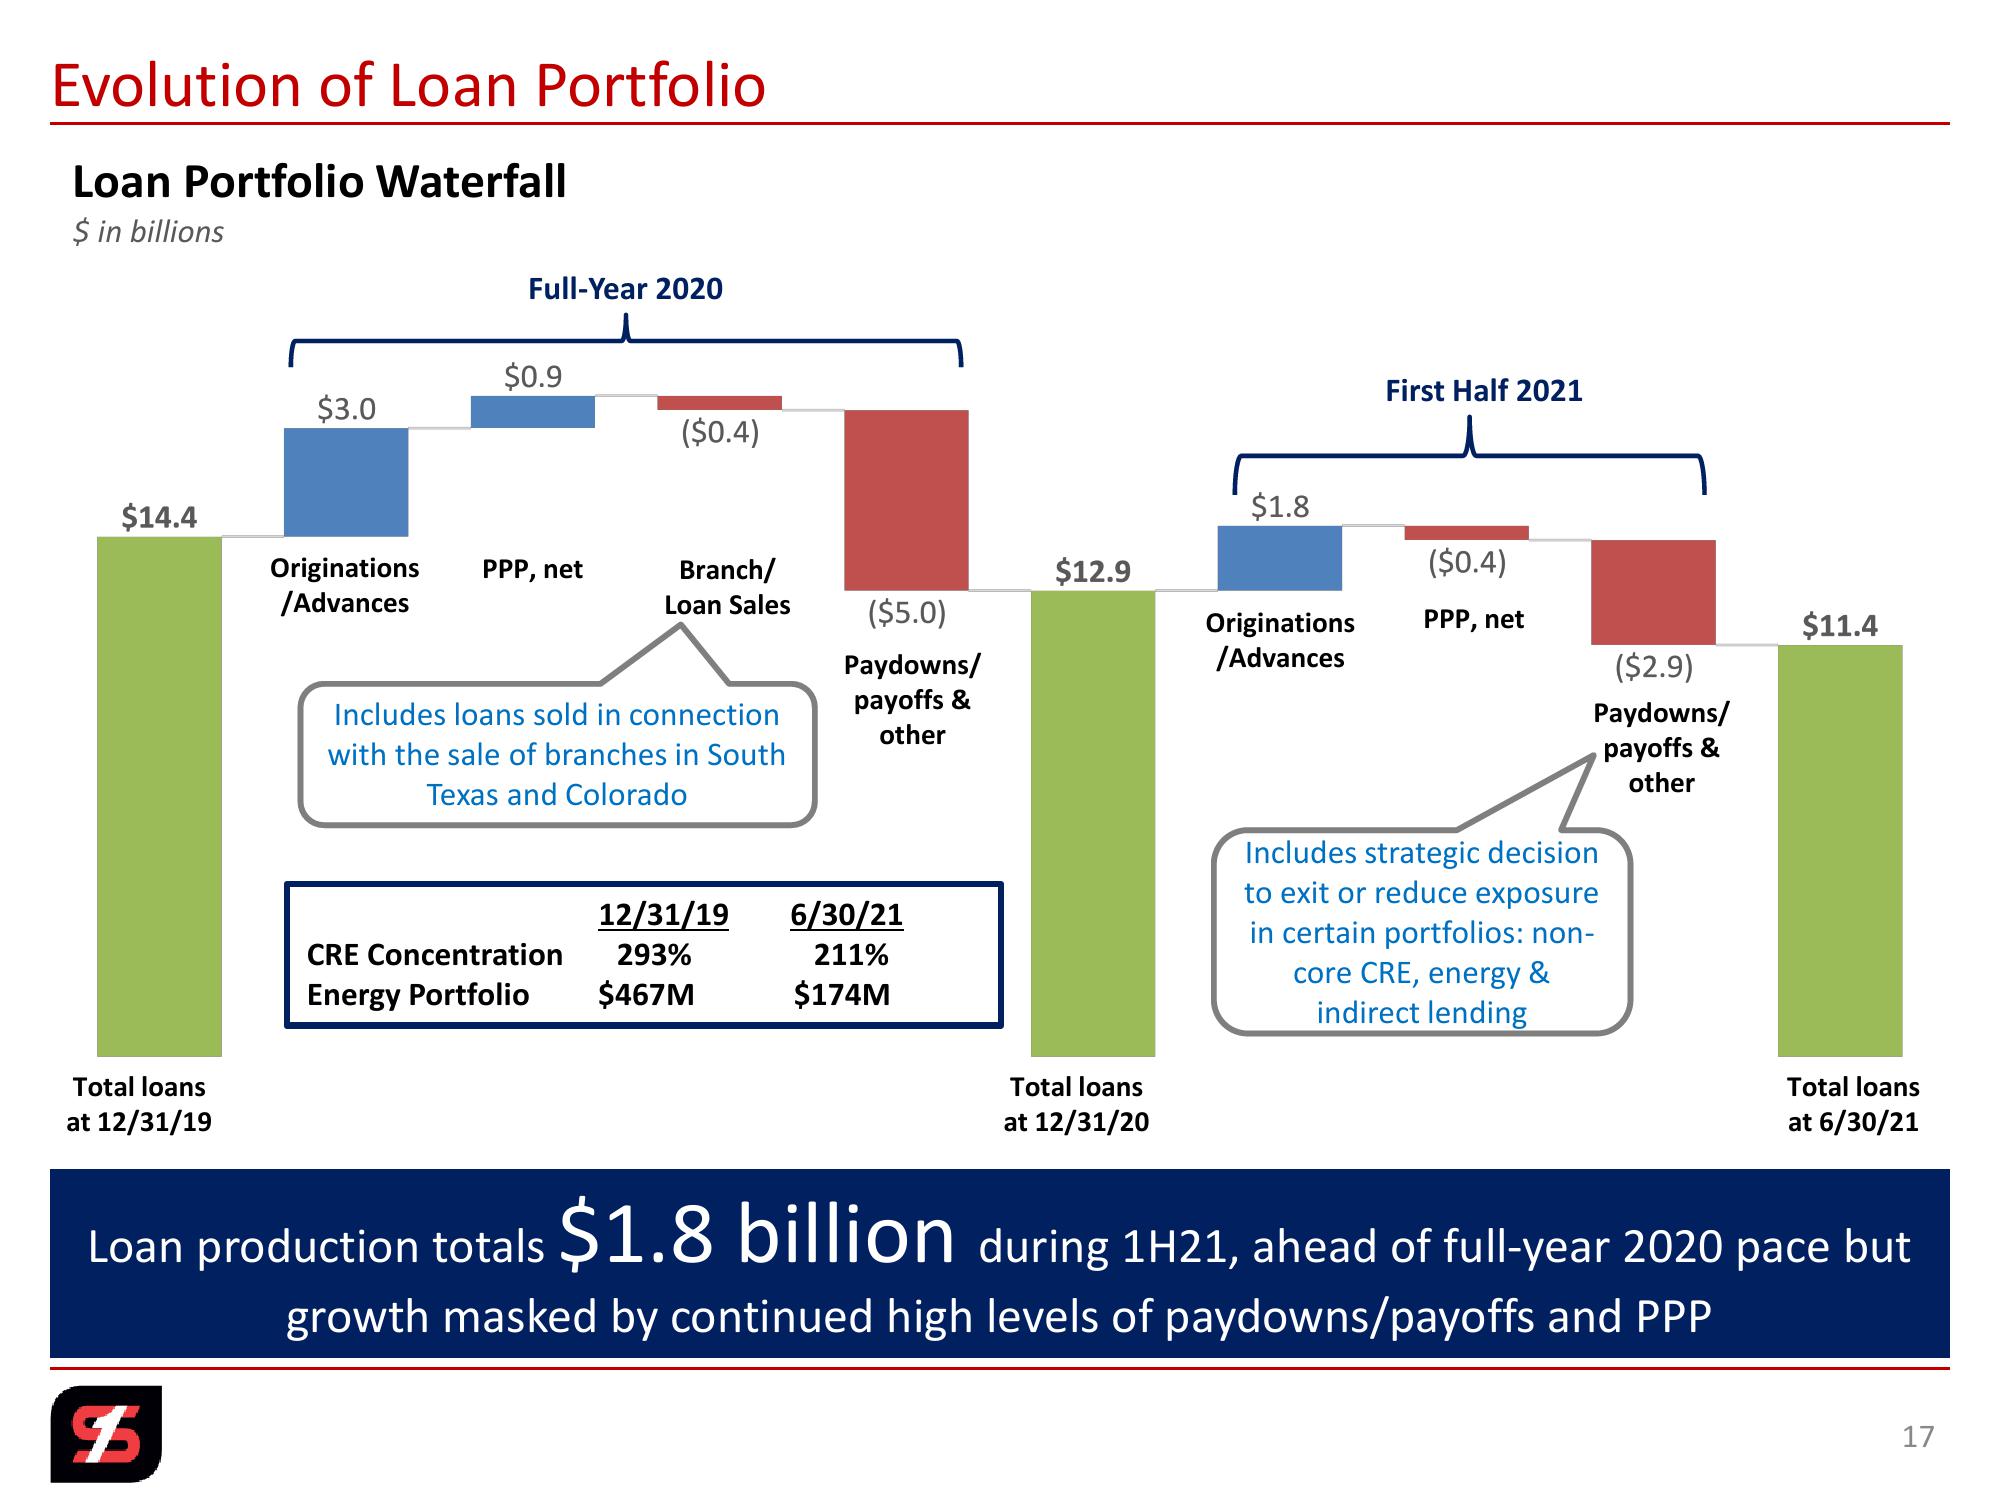
Loan production totals $1.8 billion during 1H21, ahead of full-year 2020 pace but
growth masked by continued high levels of paydowns/payoffs and PPP
$
17View entire presentation