Barclays Credit Presentation Deck
STRATEGY, TARGETS
& GUIDANCE
Strong
foundation
Growing
ECM
Investing for growth
PERFORMANCE
Expanding
coverage
Diversifying
Investment
Banking
income
Global IB
Fee Share¹
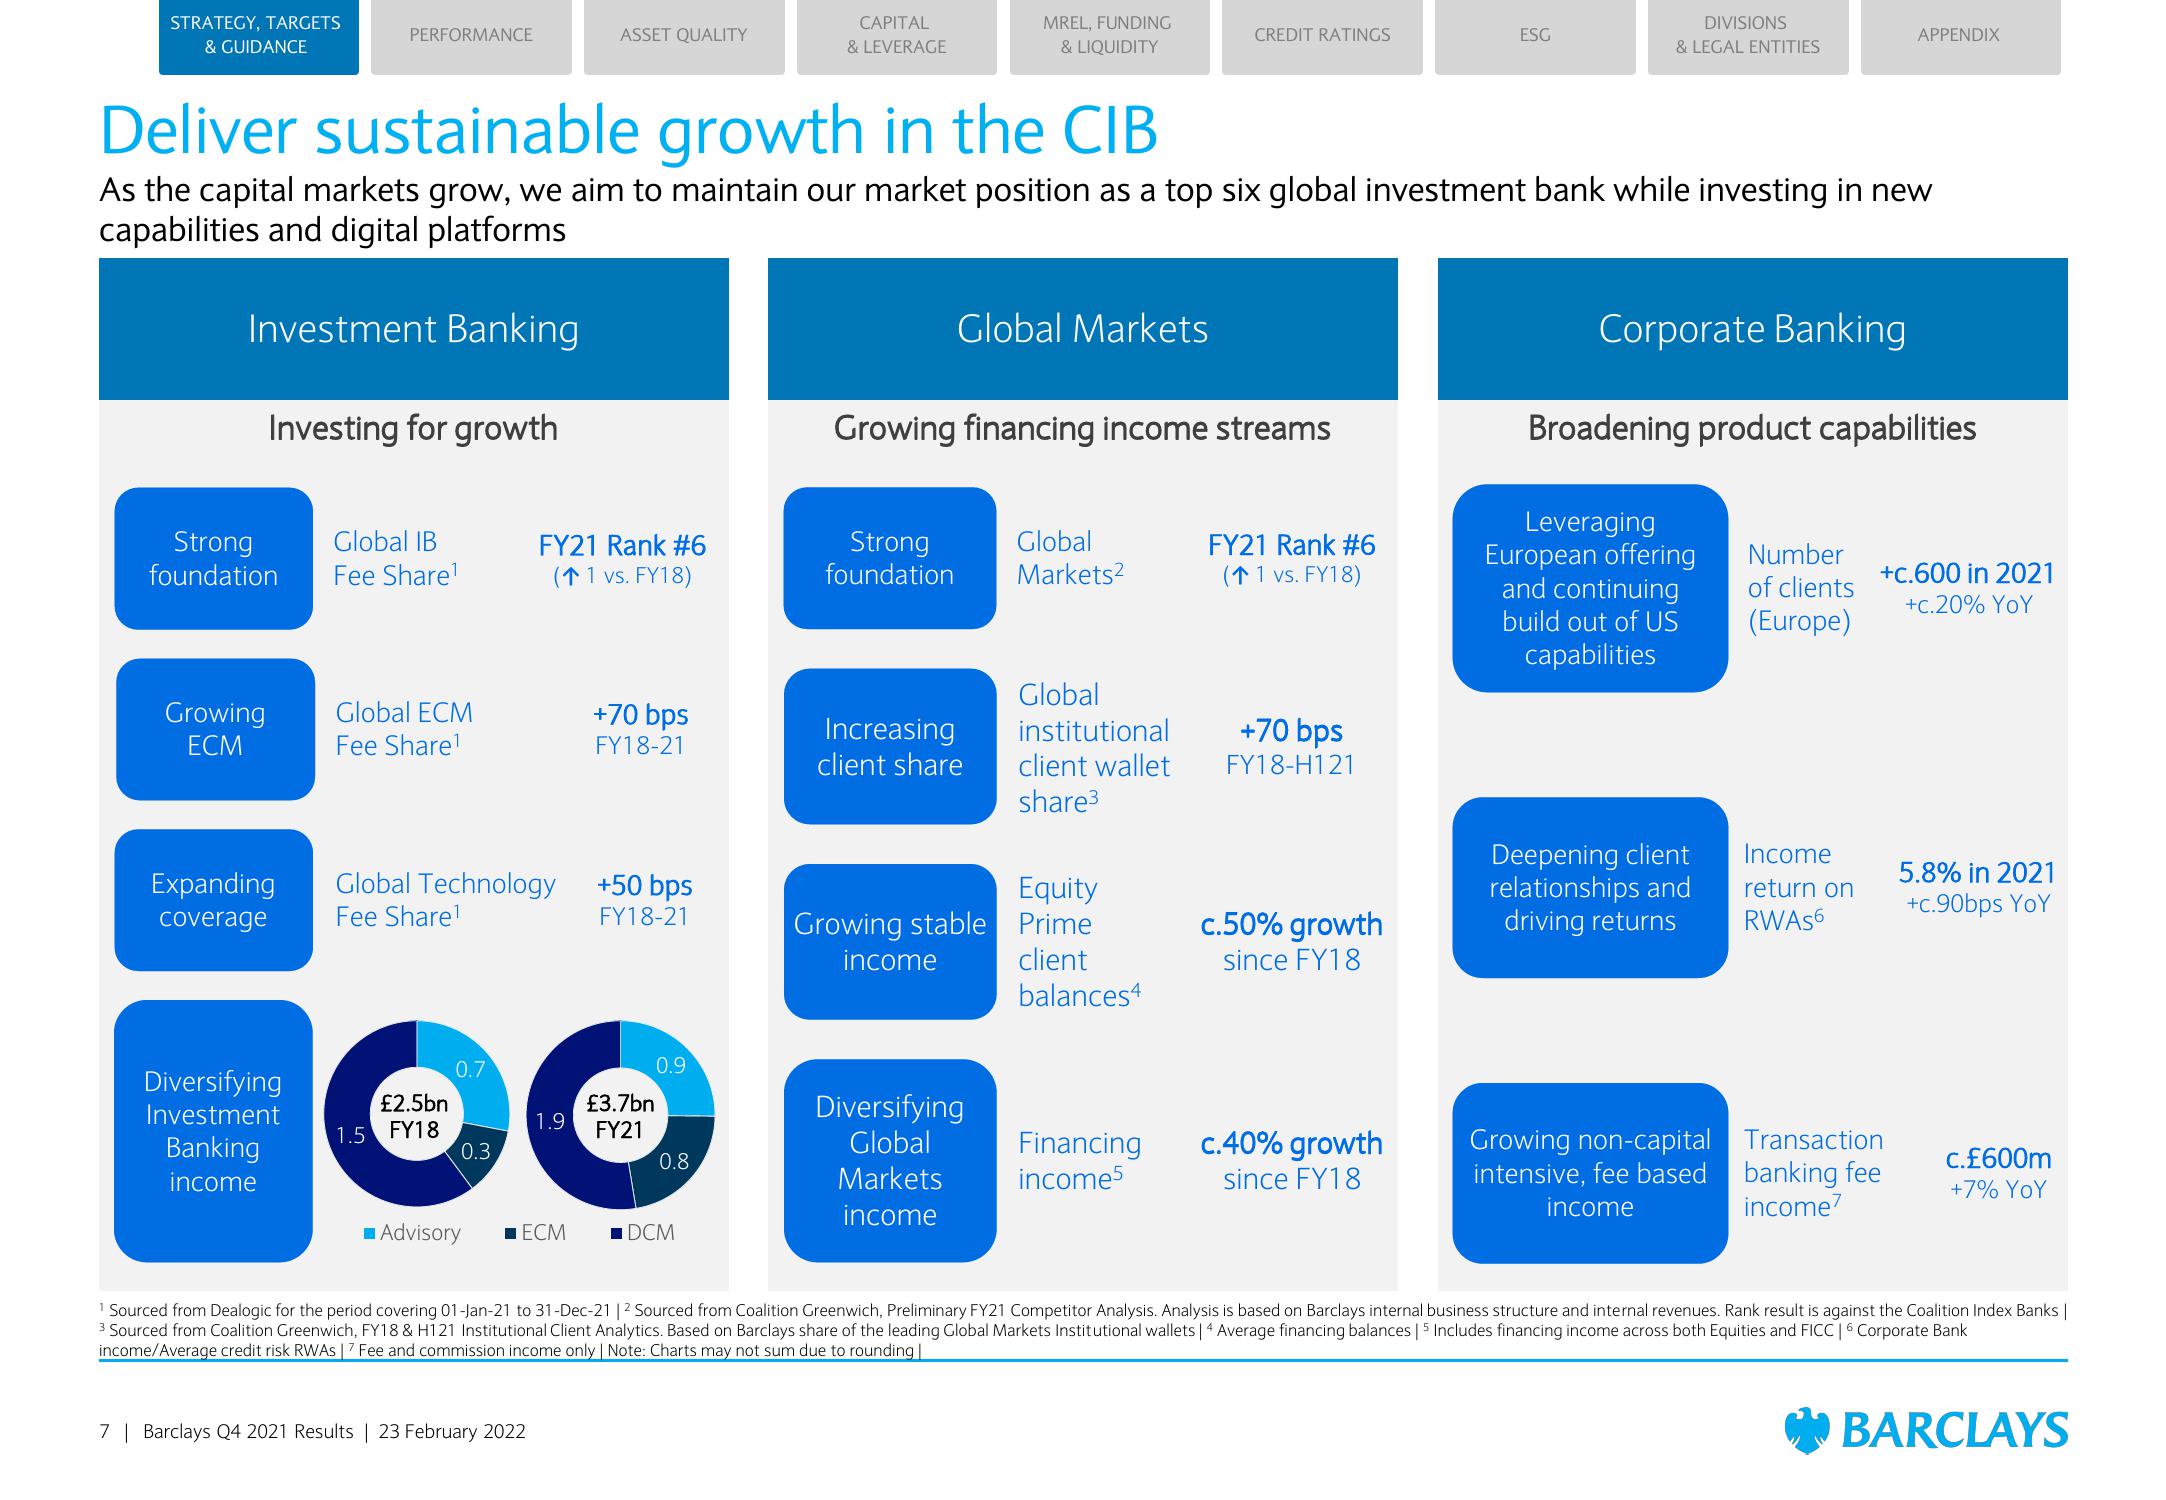
Deliver sustainable growth in the CIB
As the capital markets grow, we aim to maintain our market position as a top six global investment bank while investing in new
capabilities and digital platforms
Investment Banking
Global ECM
Fee Share¹
Global Technology
Fee Share¹
£2.5bn
1.5 FY18
0.7
0.3
■Advisory
FY21 Rank #6
(↑ 1 vs. FY18)
ASSET QUALITY
1.9
ECM
7 | Barclays Q4 2021 Results | 23 February 2022
+70 bps
FY18-21
+50 bps
FY18-21
£3.7bn
FY21
0.9
0.8
CAPITAL
& LEVERAGE
DCM
Strong
foundation
Global Markets
MREL, FUNDING
& LIQUIDITY
Growing financing income streams
Increasing
client share
Growing stable
income
Diversifying
Global
Markets
income
Global
Markets²
Global
institutional
client wallet
share³
CREDIT RATINGS
Equity
Prime
client
balances4
Financing
income5
FY21 Rank #6
(↑ 1 vs. FY18)
+70 bps
FY18-H121
c.50% growth
since FY18
ESG
c.40% growth
since FY18
DIVISIONS
& LEGAL ENTITIES
Corporate Banking
Broadening product capabilities
Leveraging
European offering
and continuing
build out of US
capabilities
Deepening client
relationships and
driving returns
Growing non-capital
intensive, fee based
income
Number
of clients
(Europe)
APPENDIX
Income
return on
RWAS6
+c.600 in 2021
+c.20% YoY
Transaction
banking fee
income?
5.8% in 2021
+c.90bps YOY
c.£600m
+7% YoY
1 Sourced from Dealogic for the period covering 01-Jan-21 to 31-Dec-21 | 2 Sourced from Coalition Greenwich, Preliminary FY21 Competitor Analysis. Analysis is based on Barclays internal business structure and internal revenues. Rank result is against the Coalition Index Banks |
3 Sourced from Coalition Greenwich, FY18 & H121 Institutional Client Analytics. Based on Barclays share of the leading Global Markets Institutional wallets | 4 Average financing balances | 5 Includes financing income across both Equities and FICC | 6 Corporate Bank
income/Average credit risk RWAS | 7 Fee and commission income only | Note: Charts may not sum due to rounding |
BARCLAYSView entire presentation