Babylon Investor Day Presentation Deck
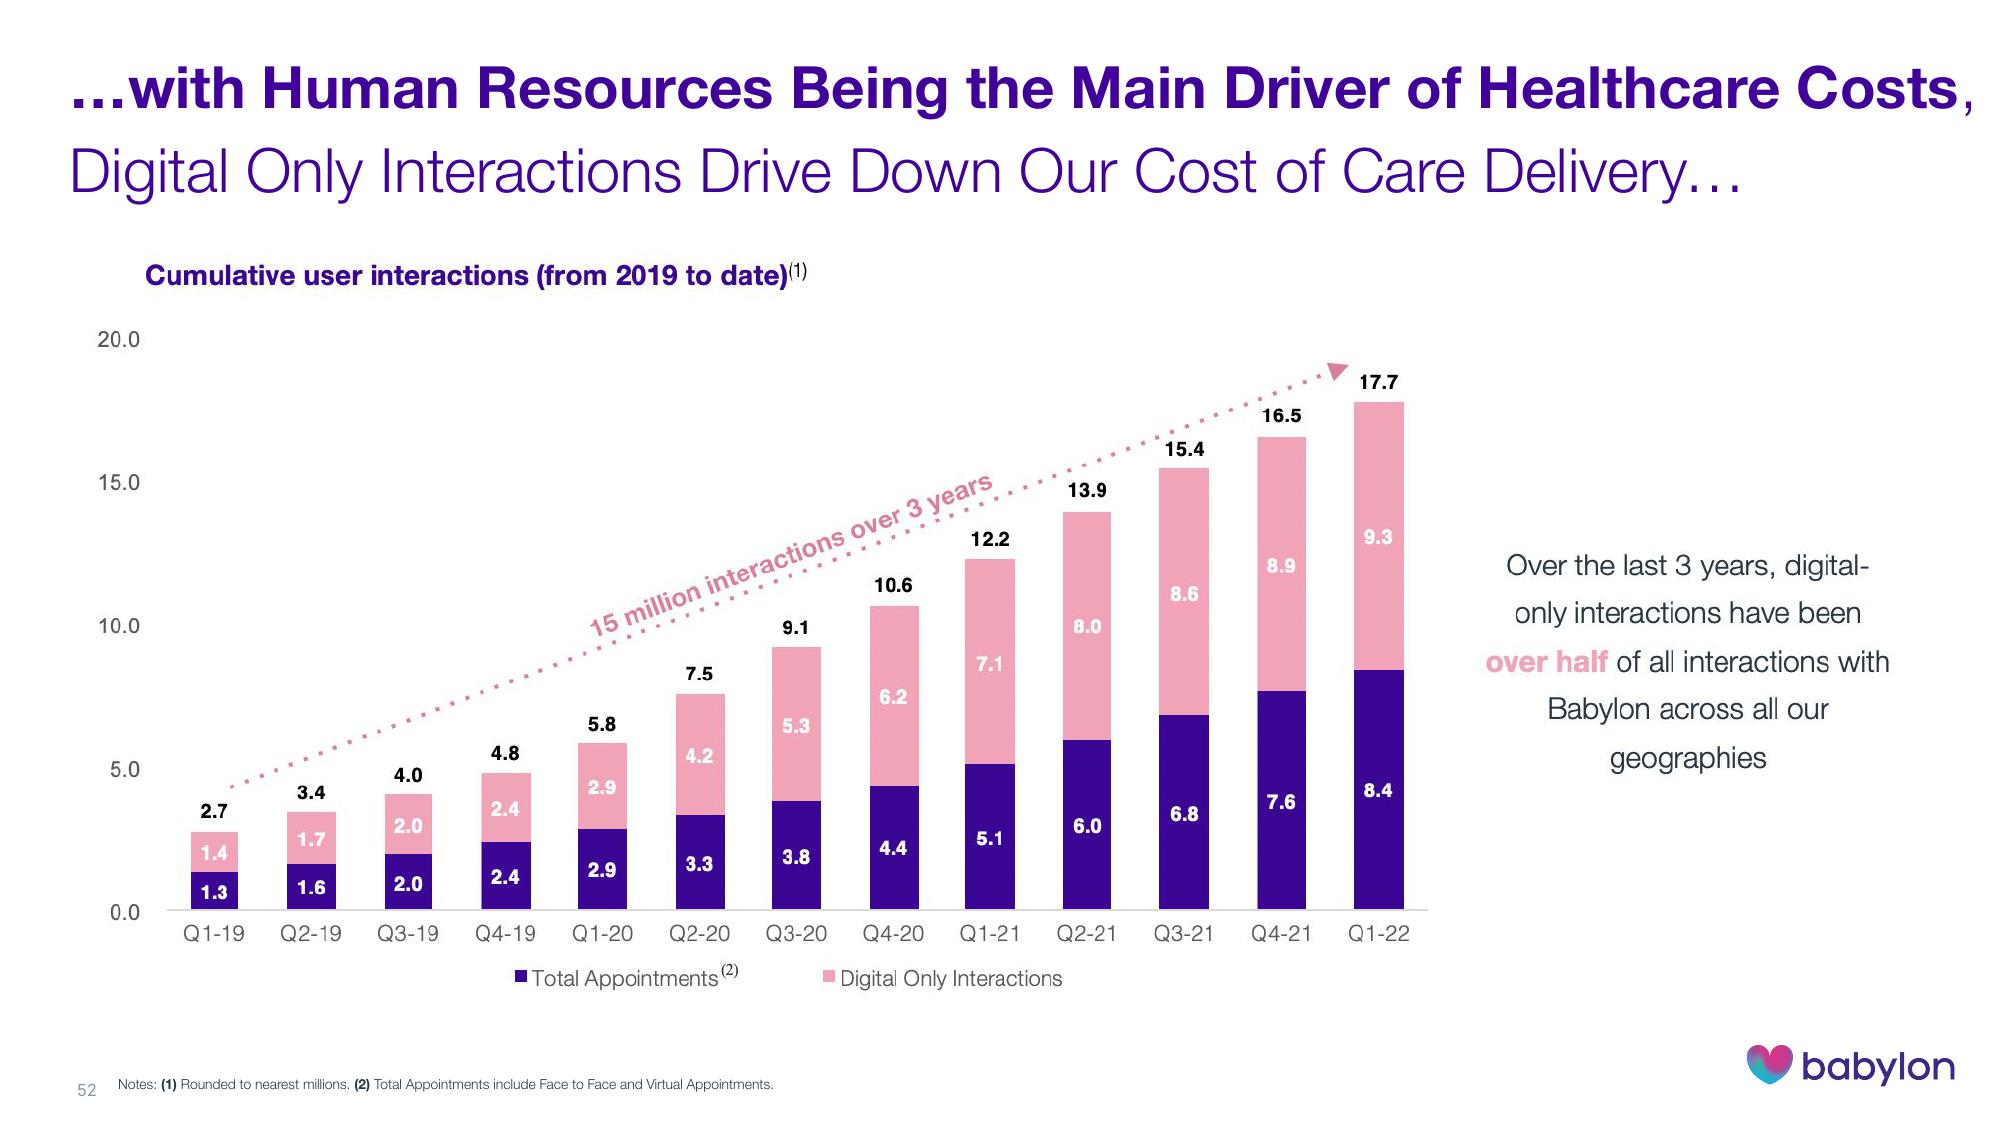
...with Human Resources Being the Main Driver of Healthcare Costs,
Digital Only Interactions Drive Down Our Cost of Care Delivery...
52
20.0
15.0
10.0
5.0
0.0
Cumulative user interactions (from 2019 to date) (¹)
2.7
1.4
1.3
Q1-19
3.4
1.7
1.6
4.0
2.0
2.0
Q2-19 Q3-19
4.8
2.4
2.4
5.8
15 million interactions over 3 years
2.9
2.9
7.5
4.2
3.3
Q4-19 Q1-20 Q2-20
Total Appointments
(2)
9.1
Notes: (1) Rounded to nearest millions. (2) Total Appointments include Face to Face and Virtual Appointments.
5.3
3.8
Q3-20
10.6
6.2
12.2
4.4
7.1
5.1
13.9
8.0
6.0
15.4
8.6
6.8
16.5
8.9
7.6
17.7
9.3
8.4
Q4-20 Q1-21 Q2-21 Q3-21 Q4-21 Q1-22
Digital Only Interactions
Over the last 3 years, digital-
only interactions have been
over half of all interactions with
Babylon across all our
geographies
babylonView entire presentation