Informatica Investor Presentation Deck
41
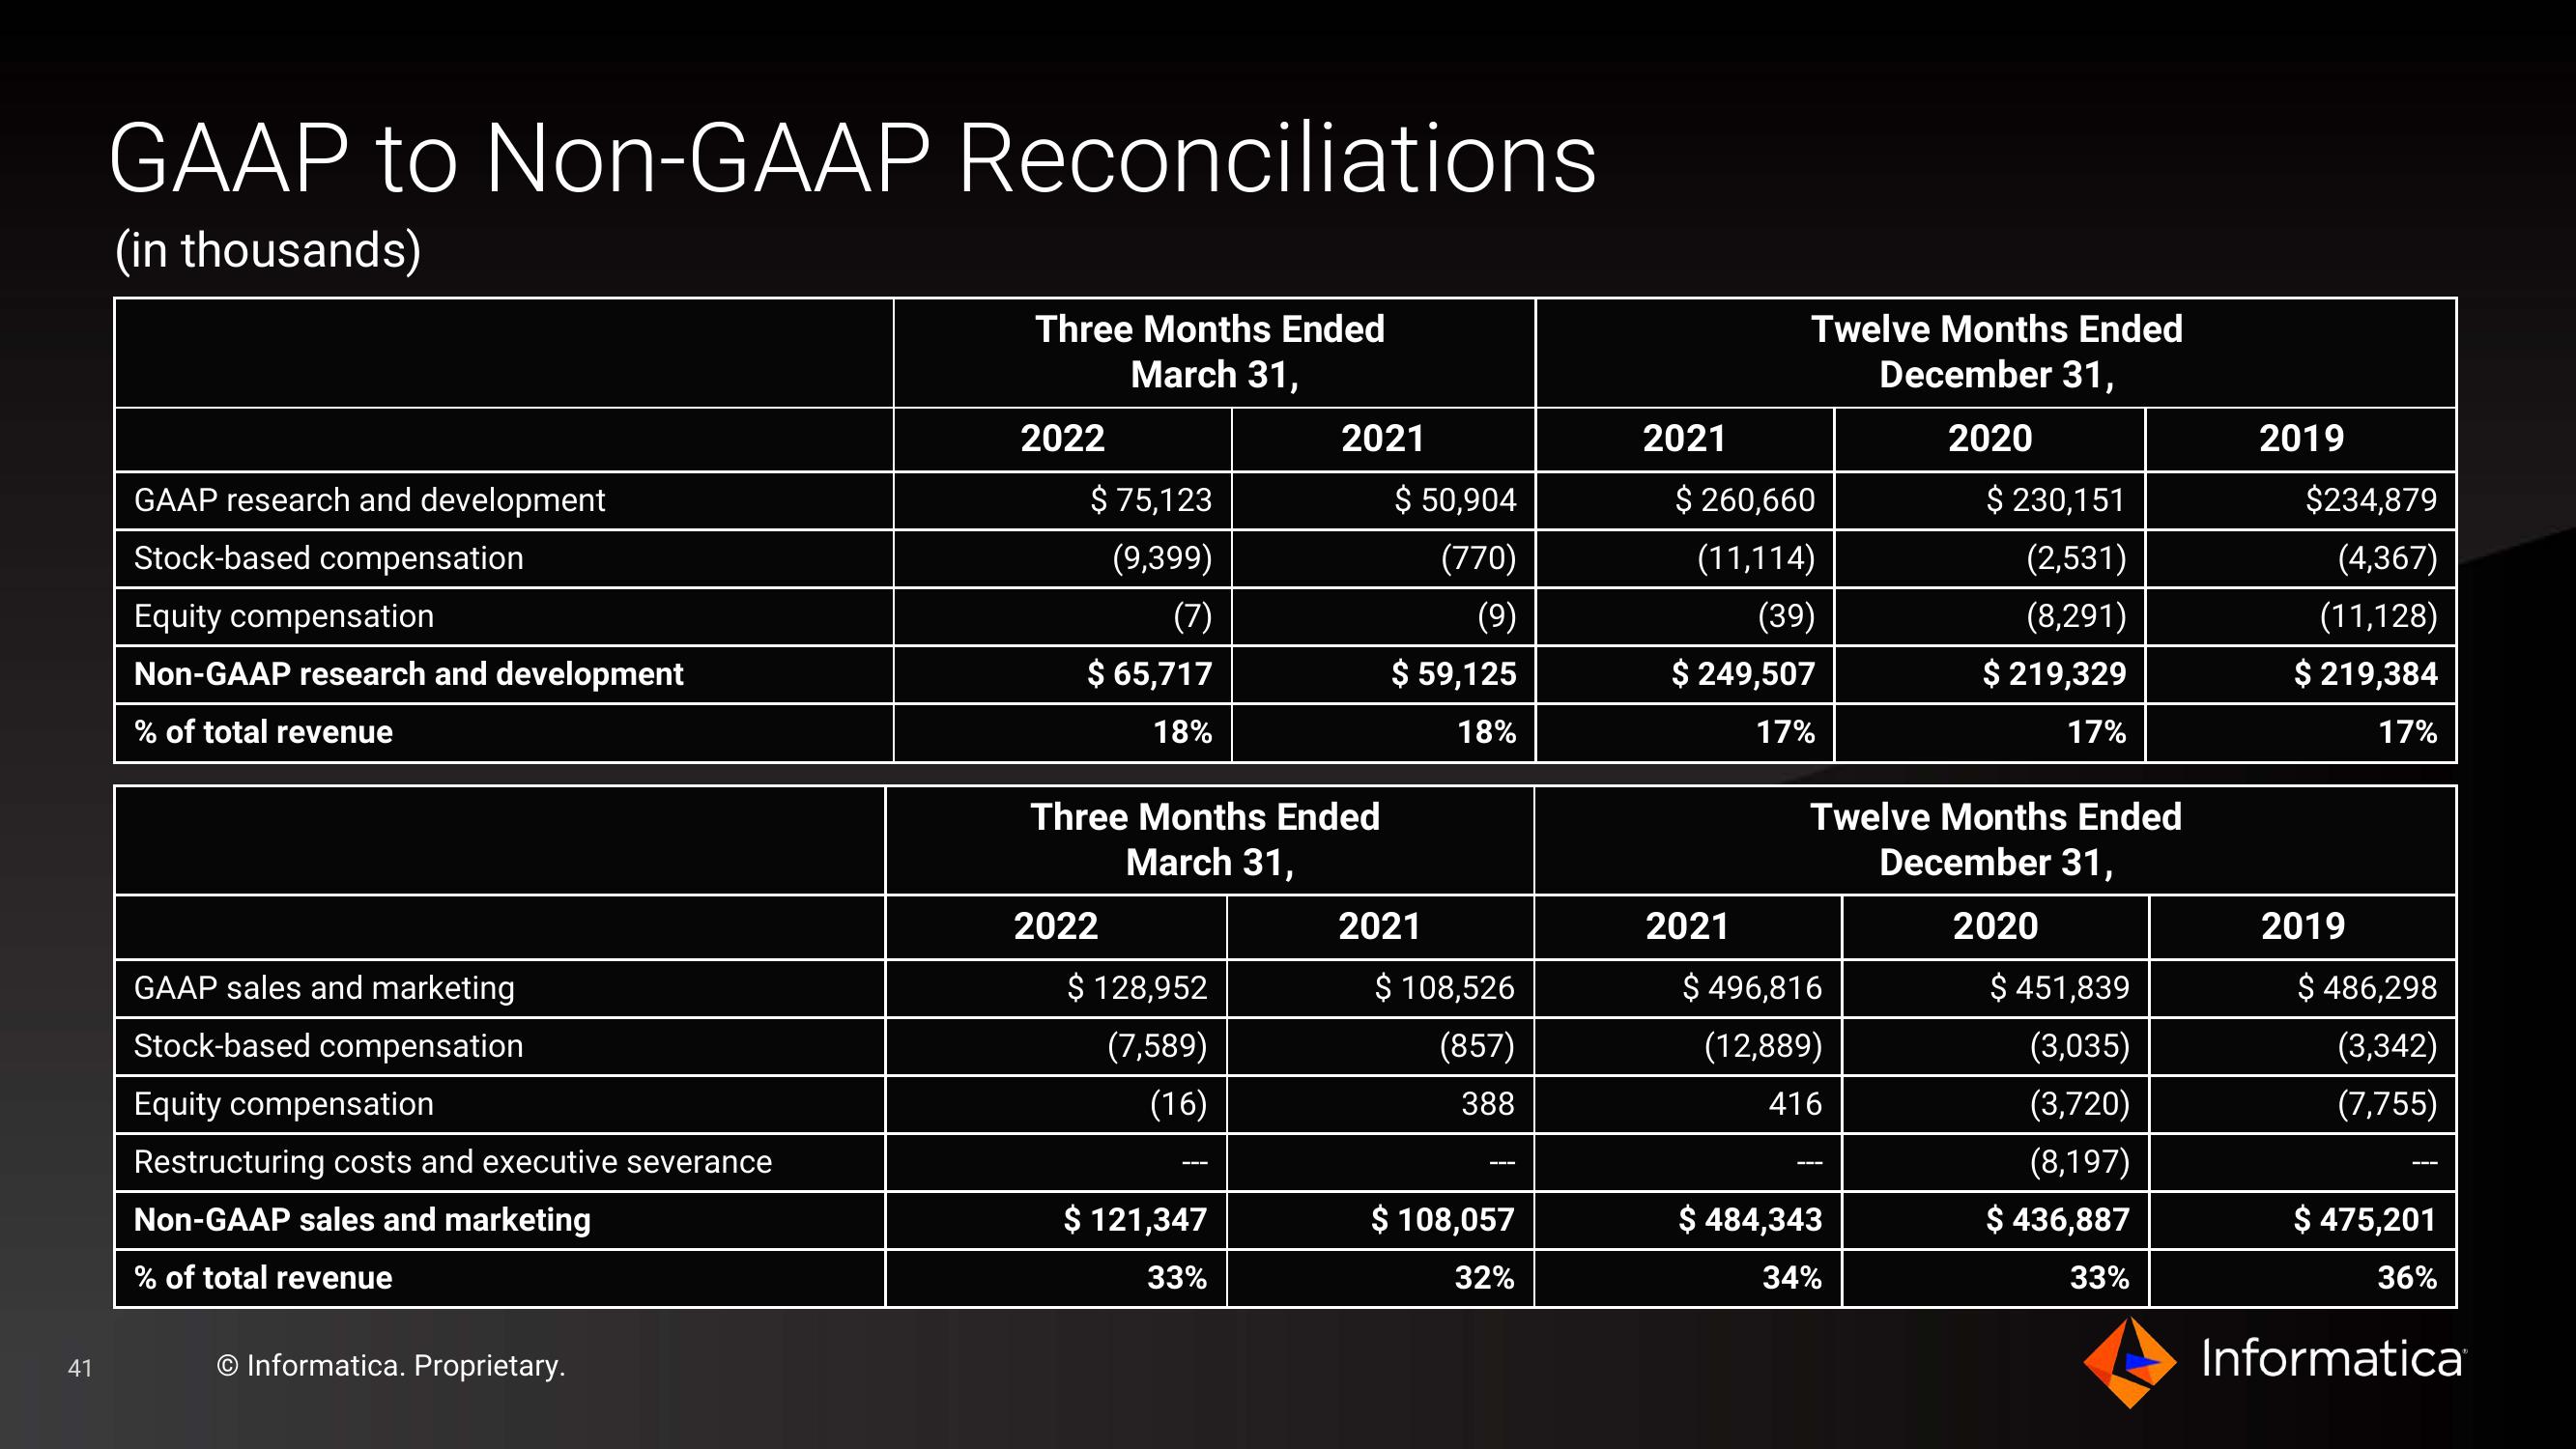
GAAP to Non-GAAP Reconciliations
(in thousands)
GAAP research and development
Stock-based compensation
Equity compensation
Non-GAAP research and development
% of total revenue
GAAP sales and marketing
Stock-based compensation
Equity compensation
Restructuring costs and executive severance
Non-GAAP sales and marketing
% of total revenue
Informatica. Proprietary.
Three Months Ended
March 31,
2022
$ 75,123
(9,399)
(7)
$ 65,717
18%
Three Months Ended
March 31,
2022
$ 128,952
(7,589)
(16)
2021
$ 121,347
33%
$ 50,904
(770)
(9)
$ 59,125
18%
2021
$ 108,526
(857)
388
===
$ 108,057
32%
2021
Twelve Months Ended
December 31,
2020
$ 260,660
(11,114)
(39)
$ 249,507
17%
2021
Twelve Months Ended
December 31,
$ 496,816
(12,889)
416
$ 230,151
(2,531)
(8,291)
$ 219,329
17%
$ 484,343
34%
2020
$ 451,839
(3,035)
(3,720)
(8,197)
$ 436,887
33%
2019
$234,879
(4,367)
(11,128)
$ 219,384
17%
2019
$ 486,298
(3,342)
(7,755)
===
$ 475,201
36%
InformaticaView entire presentation