Oatly Results Presentation Deck
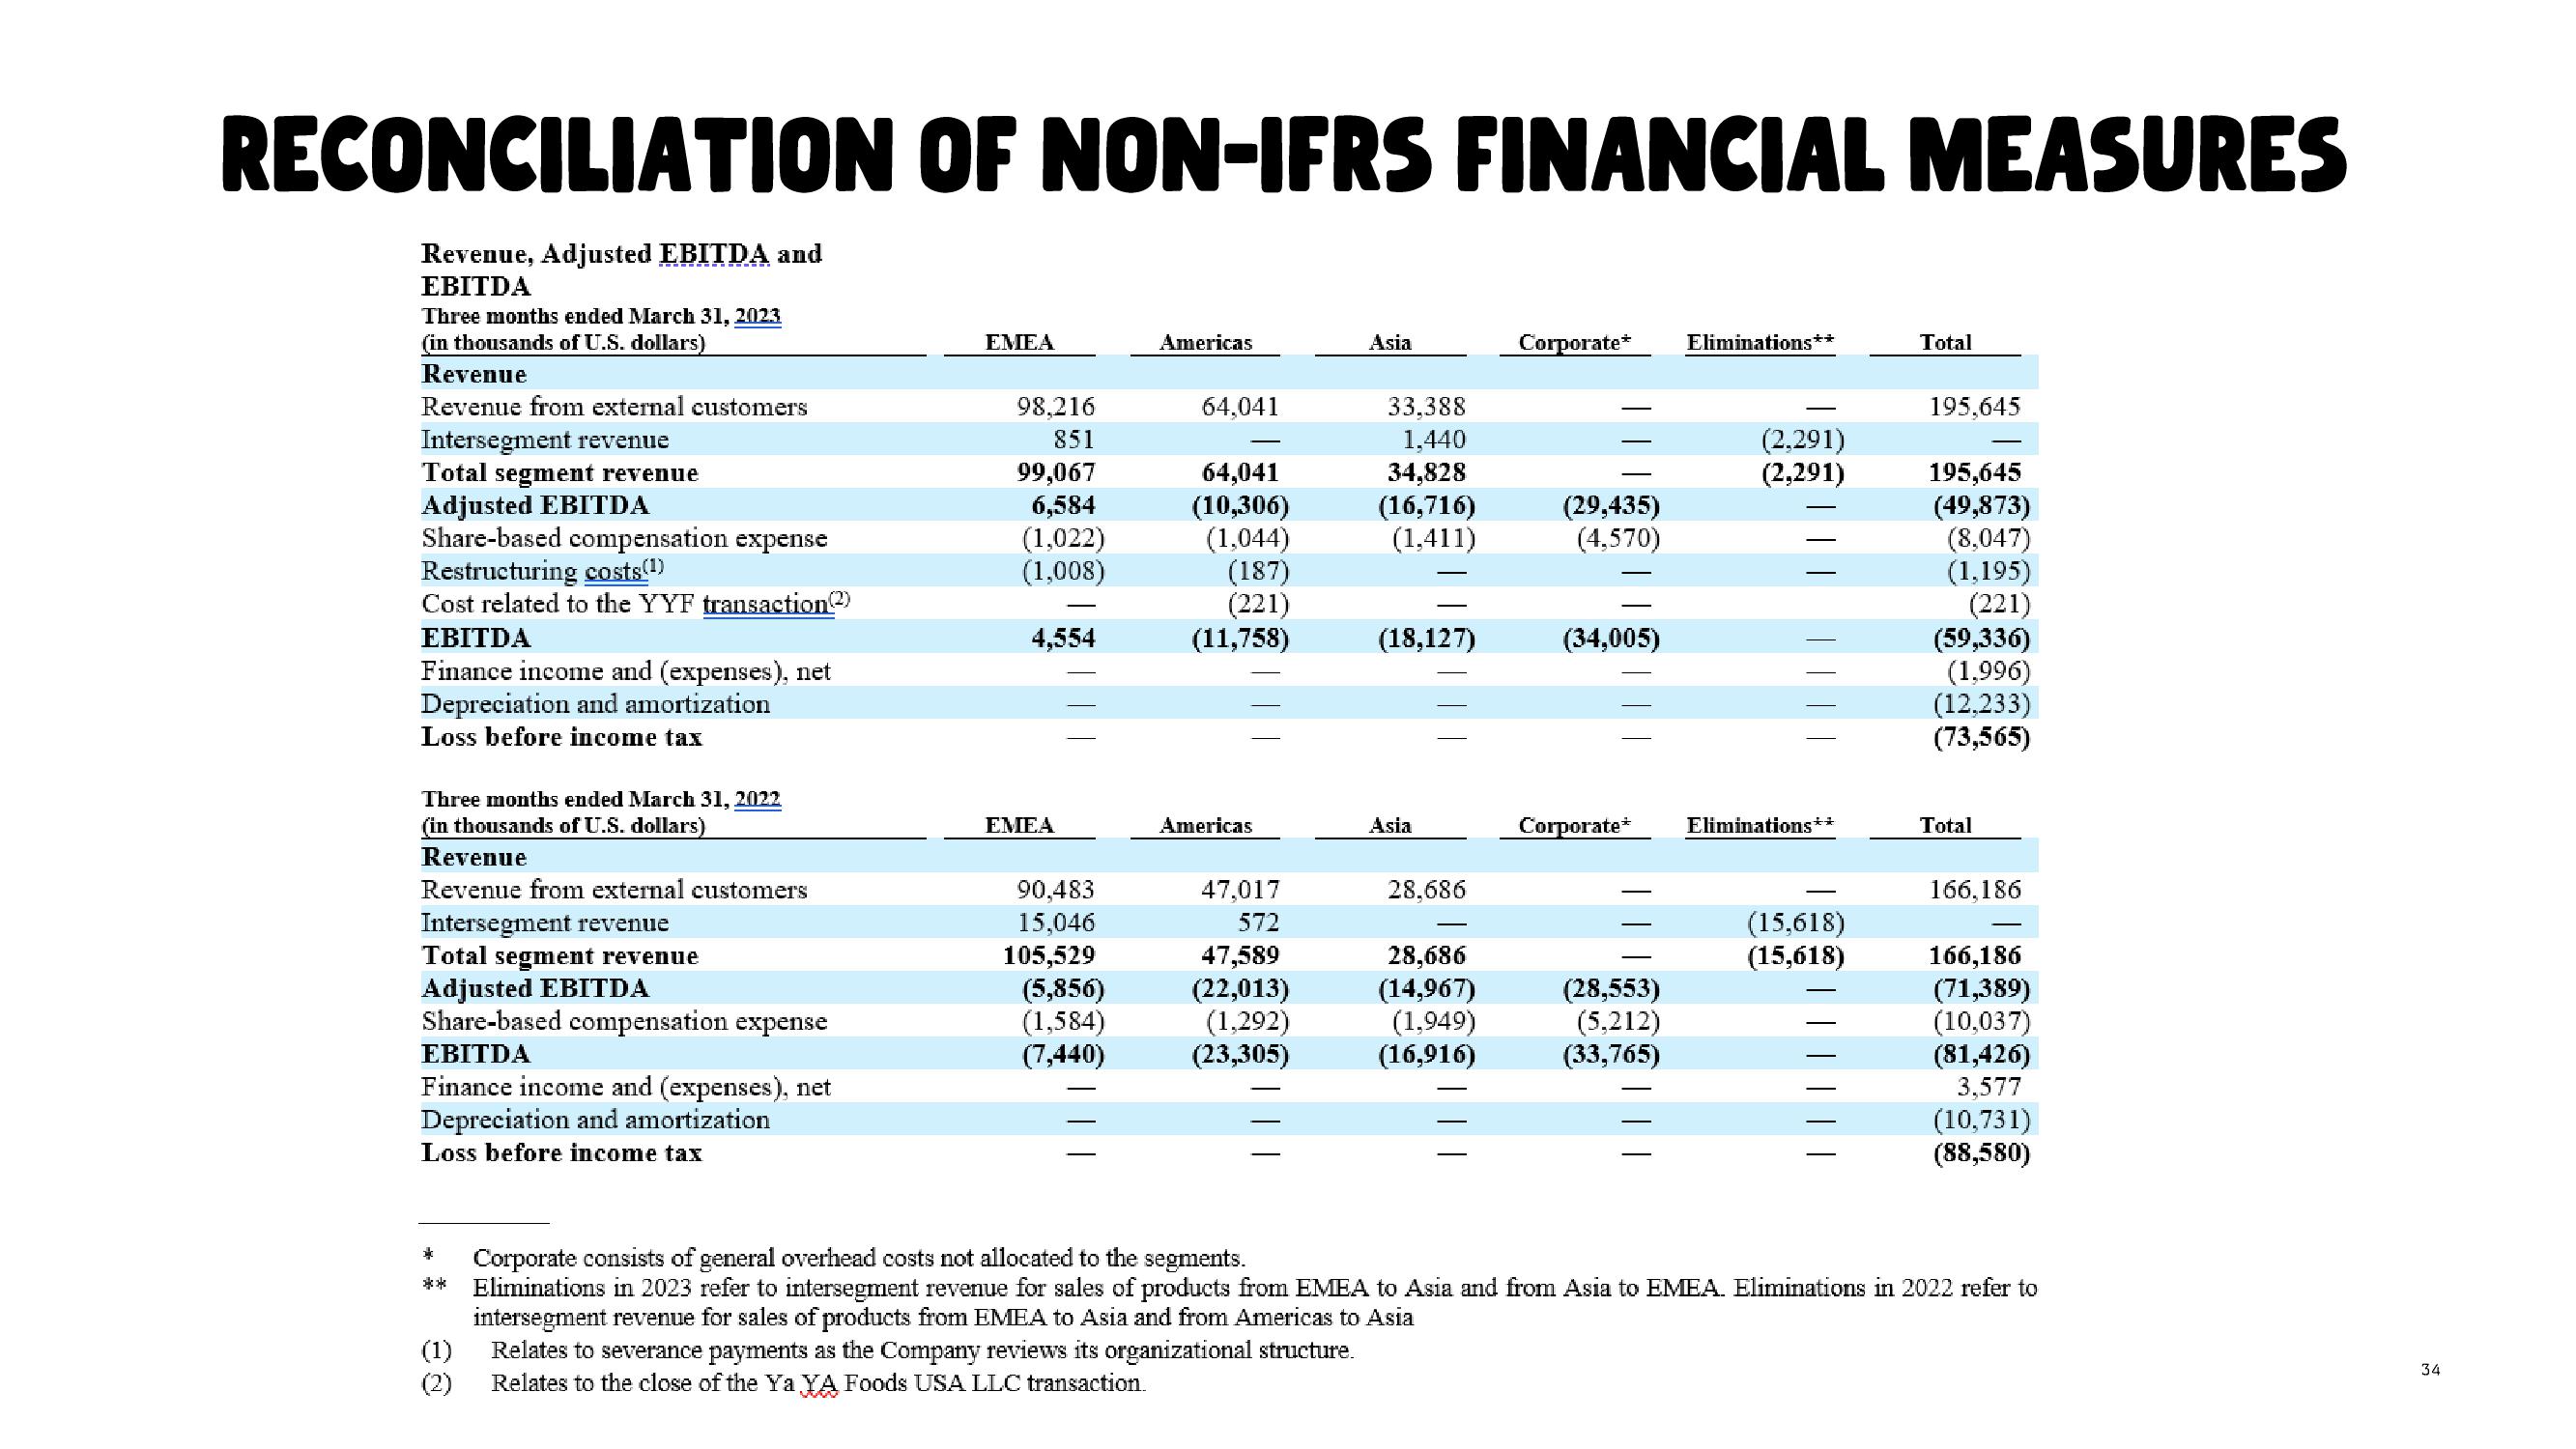
RECONCILIATION OF NON-IFRS FINANCIAL MEASURES
Revenue, Adjusted EBITDA and
EBITDA
Three months ended March 31, 2023
(in thousands of U.S. dollars)
Revenue
Revenue from external customers
Intersegment revenue
Total segment revenue
Adjusted EBITDA
Share-based compensation expense
Restructuring costs(1)
Cost related to the YYF transaction (2)
EBITDA
Finance income and (expenses), net
Depreciation and amortization
Loss before income tax
Three months ended March 31, 2022
(in thousands of U.S. dollars)
Revenue
Revenue from external customers
Intersegment revenue
Total segment revenue
Adjusted EBITDA
Share-based compensation expense
EBITDA
Finance income and (expenses), net
Depreciation and amortization
Loss before income tax
*
(1)
EMEA
98,216
851
99,067
6,584
(1,022)
(1,008)
4,554
EMEA
90,483
15,046
105,529
(5,856)
(1,584)
(7,440)
Americas
64,041
64,041
(10,306)
(1,044)
(187)
(221)
(11,758)
Americas
47,017
572
47,589
(22,013)
(1,292)
(23,305)
Asia
33,388
1.440
34,828
(16,716)
(1,411)
(18,127)
Asia
28,686
28,686
(14,967)
(1,949)
(16,916)
Corporate*
(29,435)
(4,570)
(34,005)
Corporate*
(28,553)
(5,212)
(33,765)
Eliminations**
(2,291)
(2,291)
Eliminations**
(15,618)
(15,618)
Total
195,645
195,645
(49,873)
(8,047)
(1,195)
(221)
(59,336)
(1,996)
(12,233)
(73,565)
Total
166,186
166,186
(71,389)
(10,037)
(81,426)
3,577
(10,731)
(88,580)
Corporate consists of general overhead costs not allocated to the segments.
Eliminations in 2023 refer to intersegment revenue for sales of products from EMEA to Asia and from Asia to EMEA. Eliminations in 2022 refer to
intersegment revenue for sales of products from EMEA to Asia and from Americas to Asia
Relates to severance payments as the Company reviews its organizational structure.
Relates to the close of the Ya YA Foods USA LLC transaction.
34View entire presentation