Taboola Investor Presentation Deck
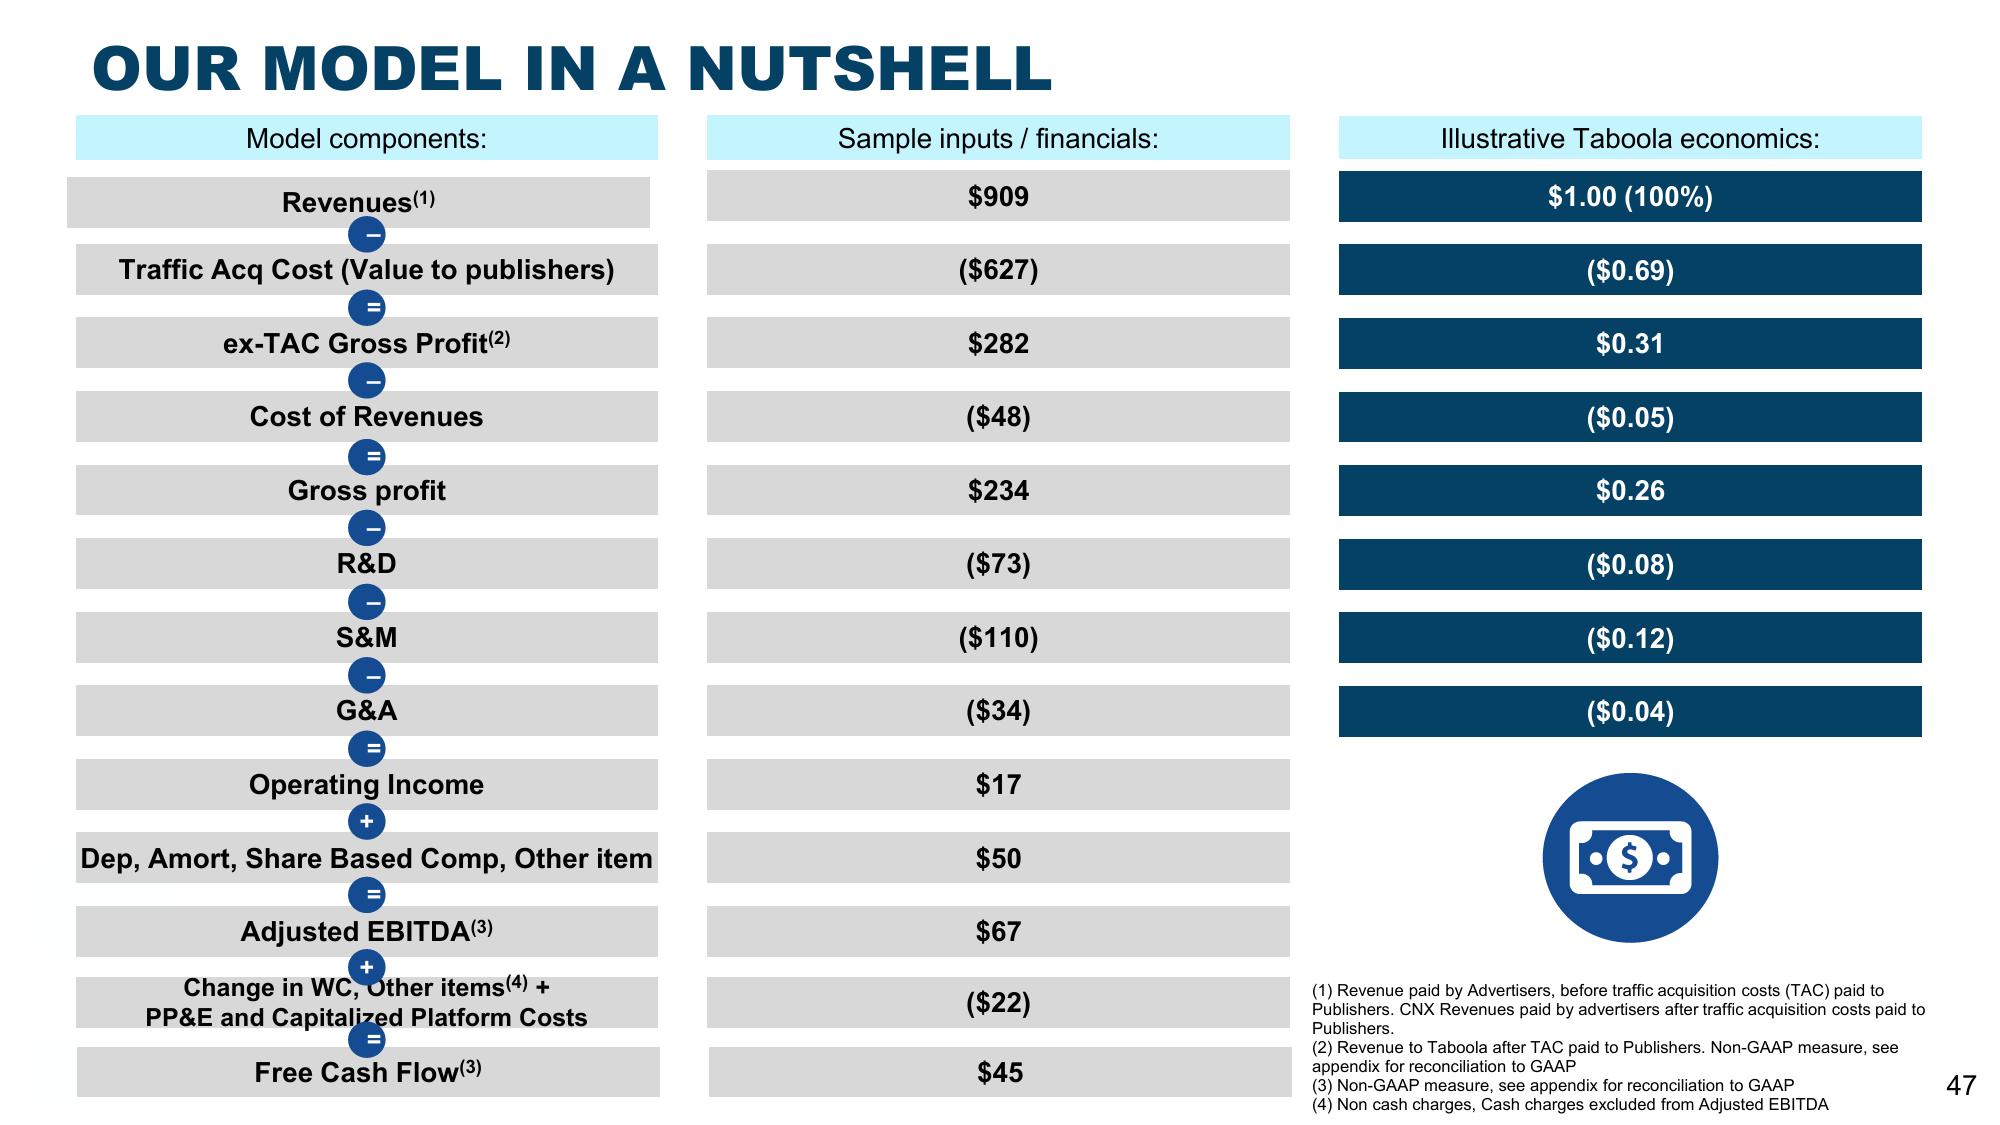
OUR MODEL IN A NUTSHELL
Model components:
Revenues (1)
Traffic Acq Cost (Value to publishers)
ex-TAC Gross Profit (2)
Cost of Revenues
Gross profit
R&D
S&M
G&A
Operating Income
+
Dep, Amort, Share Based Comp, Other item
Adjusted EBITDA(³)
+
Change in WC, Other items (4) +
PP&E and Capitalized Platform Costs
Free Cash Flow (3)
Sample inputs / financials:
$909
($627)
$282
($48)
$234
($73)
($110)
($34)
$17
$50
$67
($22)
$45
Illustrative Taboola economics:
$1.00 (100%)
($0.69)
$0.31
($0.05)
$0.26
($0.08)
($0.12)
($0.04)
(1) Revenue paid by Advertisers, before traffic acquisition costs (TAC) paid to
Publishers. CNX Revenues paid by advertisers after traffic acquisition costs paid to
Publishers.
(2) Revenue to Taboola after TAC paid to Publishers. Non-GAAP measure, see
appendix for reconciliation to GAAP
(3) Non-GAAP measure, see appendix for reconciliation to GAAP
(4) Non cash charges, Cash charges excluded from Adjusted EBITDA
47View entire presentation