dLocal Investor Day Presentation Deck
2
NRR driven by high
growth and low churn
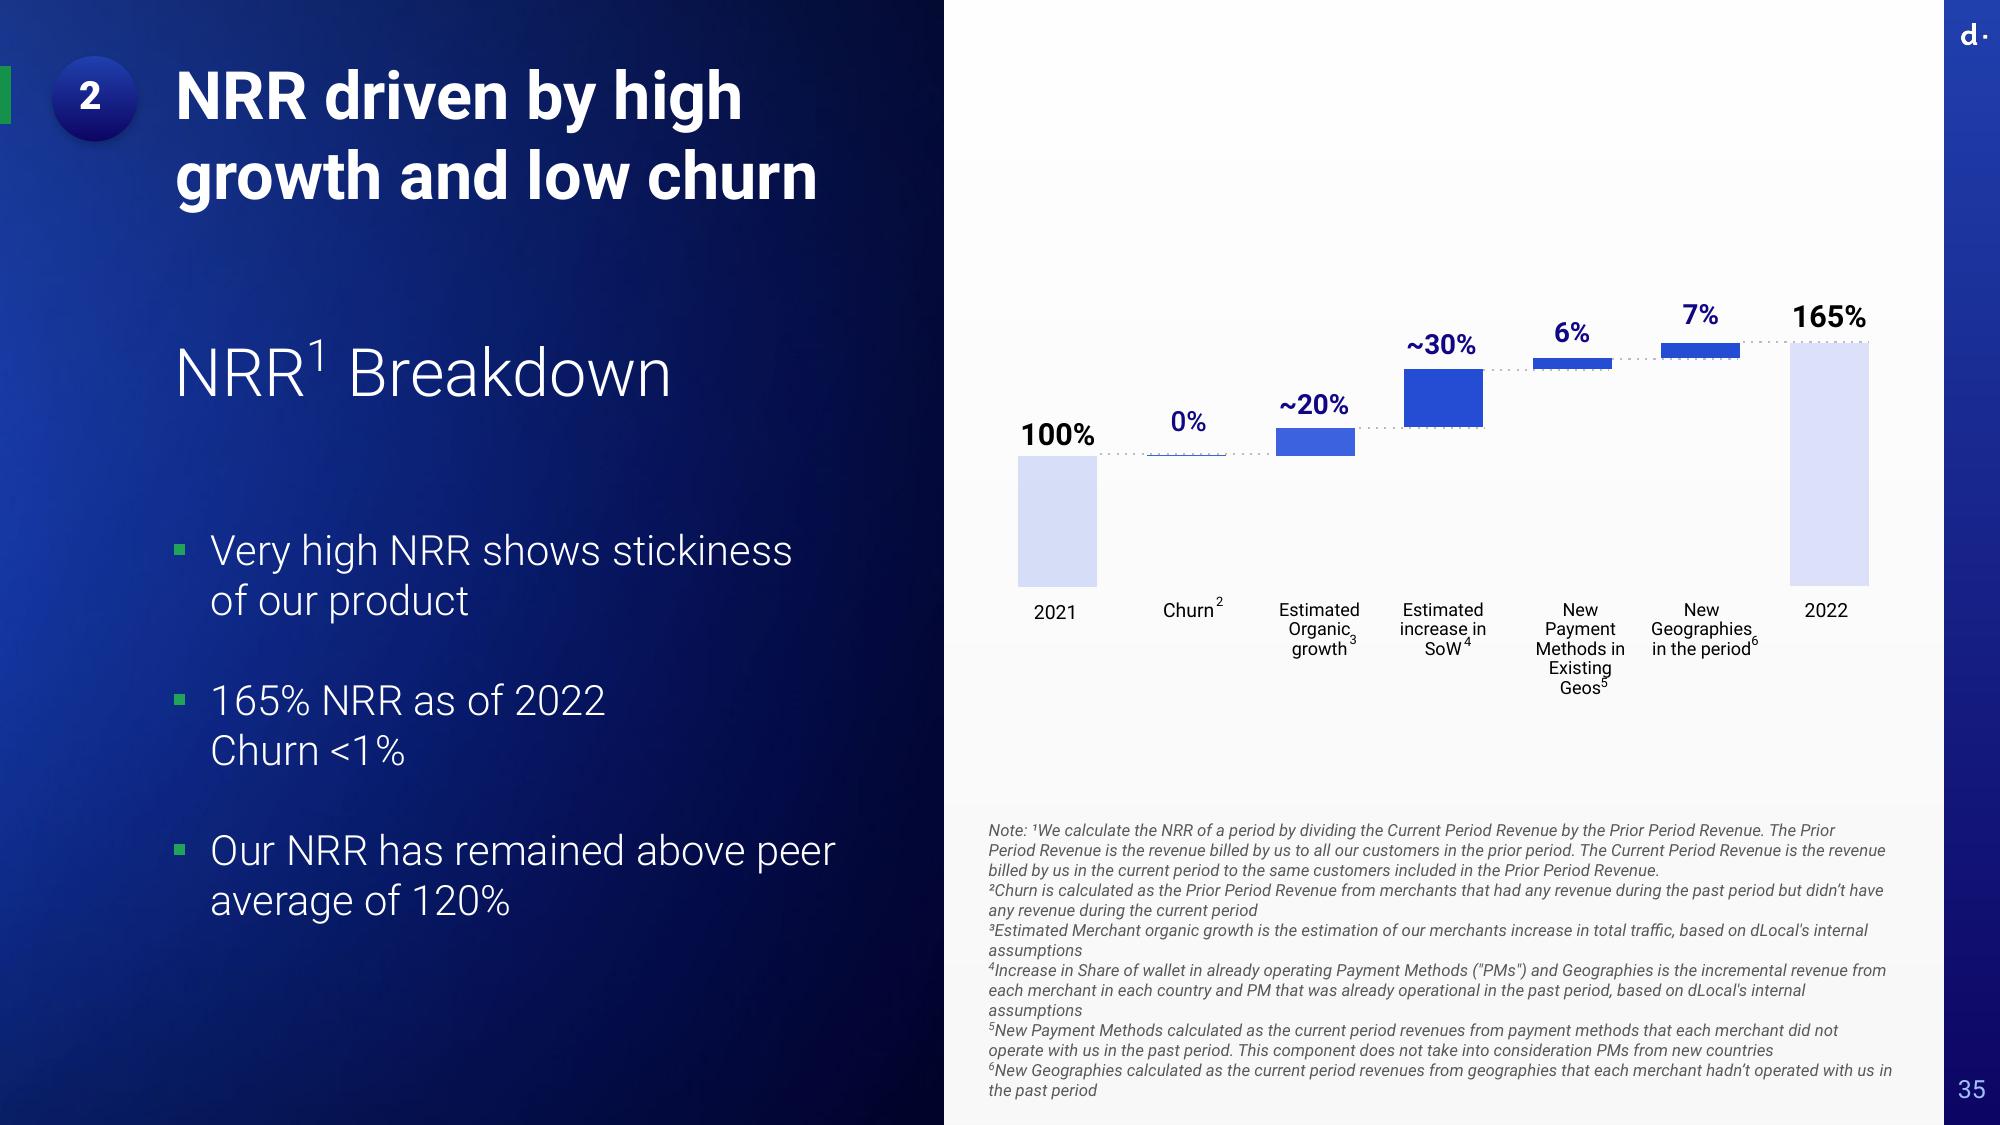
NRR¹ Breakdown
Very high NRR shows stickiness
of our product
▪ 165% NRR as of 2022
Churn <1%
Our NRR has remained above peer
average of 120%
100%
2021
0%
Churn
2
~20%
Estimated
Organic
growth
~30%
Estimated
increase in
SOW4
6%
New
Payment
Methods in
Existing
Geos
7%
New
Geographies
in the period
165%
2022
Note: 'We calculate the NRR of a period. dividing the Current Period Revenue by the Prior Period Revenue. The Prior
Period Revenue is the revenue billed by us to all our customers in the prior period. The Current Period Revenue is the revenue
billed by us in the current period to the same customers included in the Prior Period Revenue.
2Churn is calculated as the Prior Period Revenue from merchants that had any revenue during the past period but didn't have
any revenue during the current period
³Estimated Merchant organic growth is the estimation of our merchants increase in total traffic, based on dLocal's internal
assumptions
4Increase in Share of wallet in already operating Payment Methods ("PMs") and Geographies is the incremental revenue from
each merchant in each country and PM that was already operational in the past period, based on dLocal's internal
assumptions
5New Payment Methods calculated as the current period revenues from payment methods that each merchant did not
operate with us in the past period. This component does not take into consideration PMs from new countries
"New Geographies calculated as the current period revenues from geographies that each merchant hadn't operated with us in
the past period
d.
35View entire presentation