DraftKings Results Presentation Deck
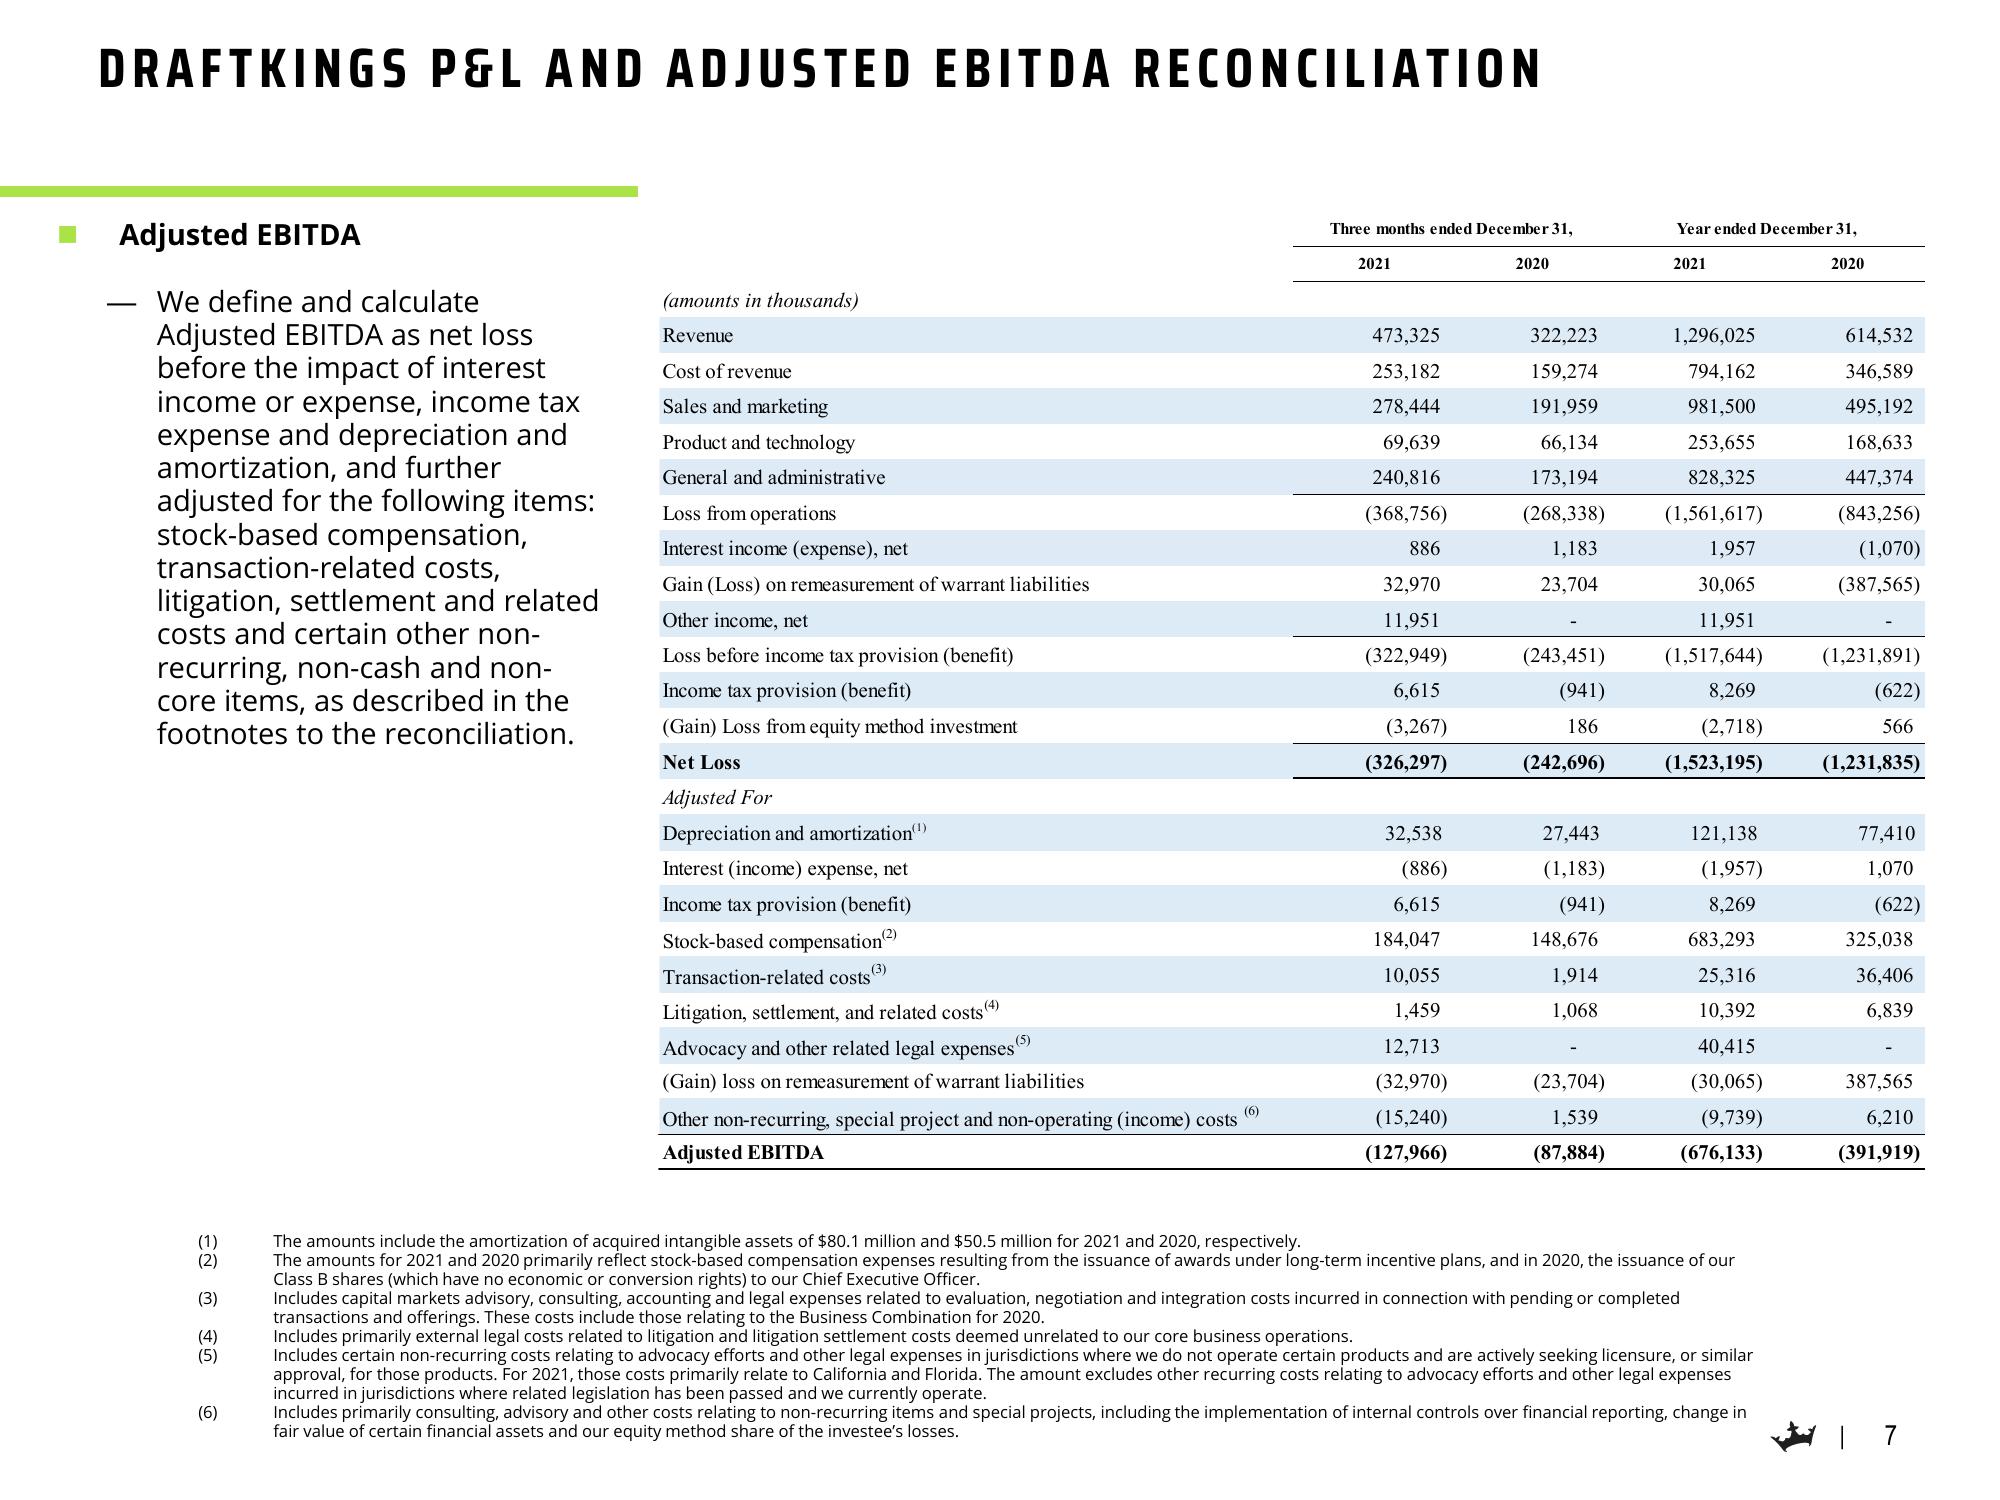
DRAFTKINGS P&L AND ADJUSTED EBITDA RECONCILIATION
Adjusted EBITDA
We define and calculate
Adjusted EBITDA as net loss
before the impact of interest
income or expense, income tax
expense and depreciation and
amortization, and further
adjusted for the following items:
stock-based compensation,
transaction-related costs,
litigation, settlement and related
costs and certain other non-
recurring, non-cash and non-
core items, as described in the
footnotes to the reconciliation.
(1)
(2)
(3)
(4)
(5)
(6)
(amounts in thousands)
Revenue
Cost of revenue
Sales and marketing
Product and technology
General and administrative
Loss from operations
Interest income (expense), net
Gain (Loss) on remeasurement of warrant liabilities
Other income, net
Loss before income tax provision (benefit)
Income tax provision (benefit)
(Gain) Loss from equity method investment
Net Loss
Adjusted For
Depreciation and amortization(¹)
Interest (income) expense, net
Income tax provision (benefit)
Stock-based compensation)
Transaction-related costs (3)
Litigation, settlement, and related costs (4)
Advocacy and other related legal expenses (5)
(Gain) loss on remeasurement of warrant liabilities.
(6)
Other non-recurring, special project and non-operating (income) costs
Adjusted EBITDA
Three months ended December 31,
2021
473,325
253,182
278,444
69,639
240,816
(368,756)
886
32,970
11,951
(322,949)
6,615
(3,267)
(326,297)
32,538
(886)
6,615
184,047
10,055
1,459
12,713
(32,970)
(15,240)
(127,966)
2020
322,223
159,274
191,959
66,134
173,194
(268,338)
1,183
23,704
(243,451)
(941)
186
(242,696)
27,443
(1,183)
(941)
148,676
1,914
1,068
(23,704)
1,539
(87,884)
Year ended December 31,
2020
2021
1,296,025
794,162
981,500
253,655
828,325
(1,561,617)
1,957
30,065
11,951
(1,517,644)
8,269
(2,718)
(1,523,195)
121,138
(1,957)
8,269
683,293
25,316
10,392
40,415
(30,065)
(9,739)
(676,133)
The amounts include the amortization of acquired intangible assets of $80.1 million and $50.5 million for 2021 and 2020, respectively.
The amounts for 2021 and 2020 primarily reflect stock-based compensation expenses resulting from the issuance of awards under long-term incentive plans, and in 2020, the issuance of our
Class B shares (which have no economic or conversion rights) to our Chief Executive Officer.
Includes capital markets advisory, consulting, accounting and legal expenses related to evaluation, negotiation and integration costs incurred in connection with pending or completed
transactions and offerings. These costs include those relating to the Business Combination for 2020.
Includes primarily external legal costs related to litigation and litigation settlement costs deemed unrelated to our core business operations.
Includes certain non-recurring costs relating to advocacy efforts and other legal expenses in jurisdictions where we do not operate certain products and are actively seeking licensure, or similar
approval, for those products. For 2021, those costs primarily relate to California and Florida. The amount excludes other recurring costs relating to advocacy efforts and other legal expenses
incurred in jurisdictions where related legislation has been passed and we currently operate.
Includes primarily consulting, advisory and other costs relating to non-recurring items and special projects, including the implementation of internal controls over financial reporting, change in
fair value of certain financial assets and our equity method share of the investee's losses.
614,532
346,589
495,192
168,633
447,374
(843,256)
(1,070)
(387,565)
(1,231,891)
(622)
566
(1,231,835)
77,410
1,070
(622)
325,038
36,406
6,839
387,565
6,210
(391,919)View entire presentation