Apollo Global Management Investor Day Presentation Deck slide image

Apollo Global Management Investor Day Presentation Deck

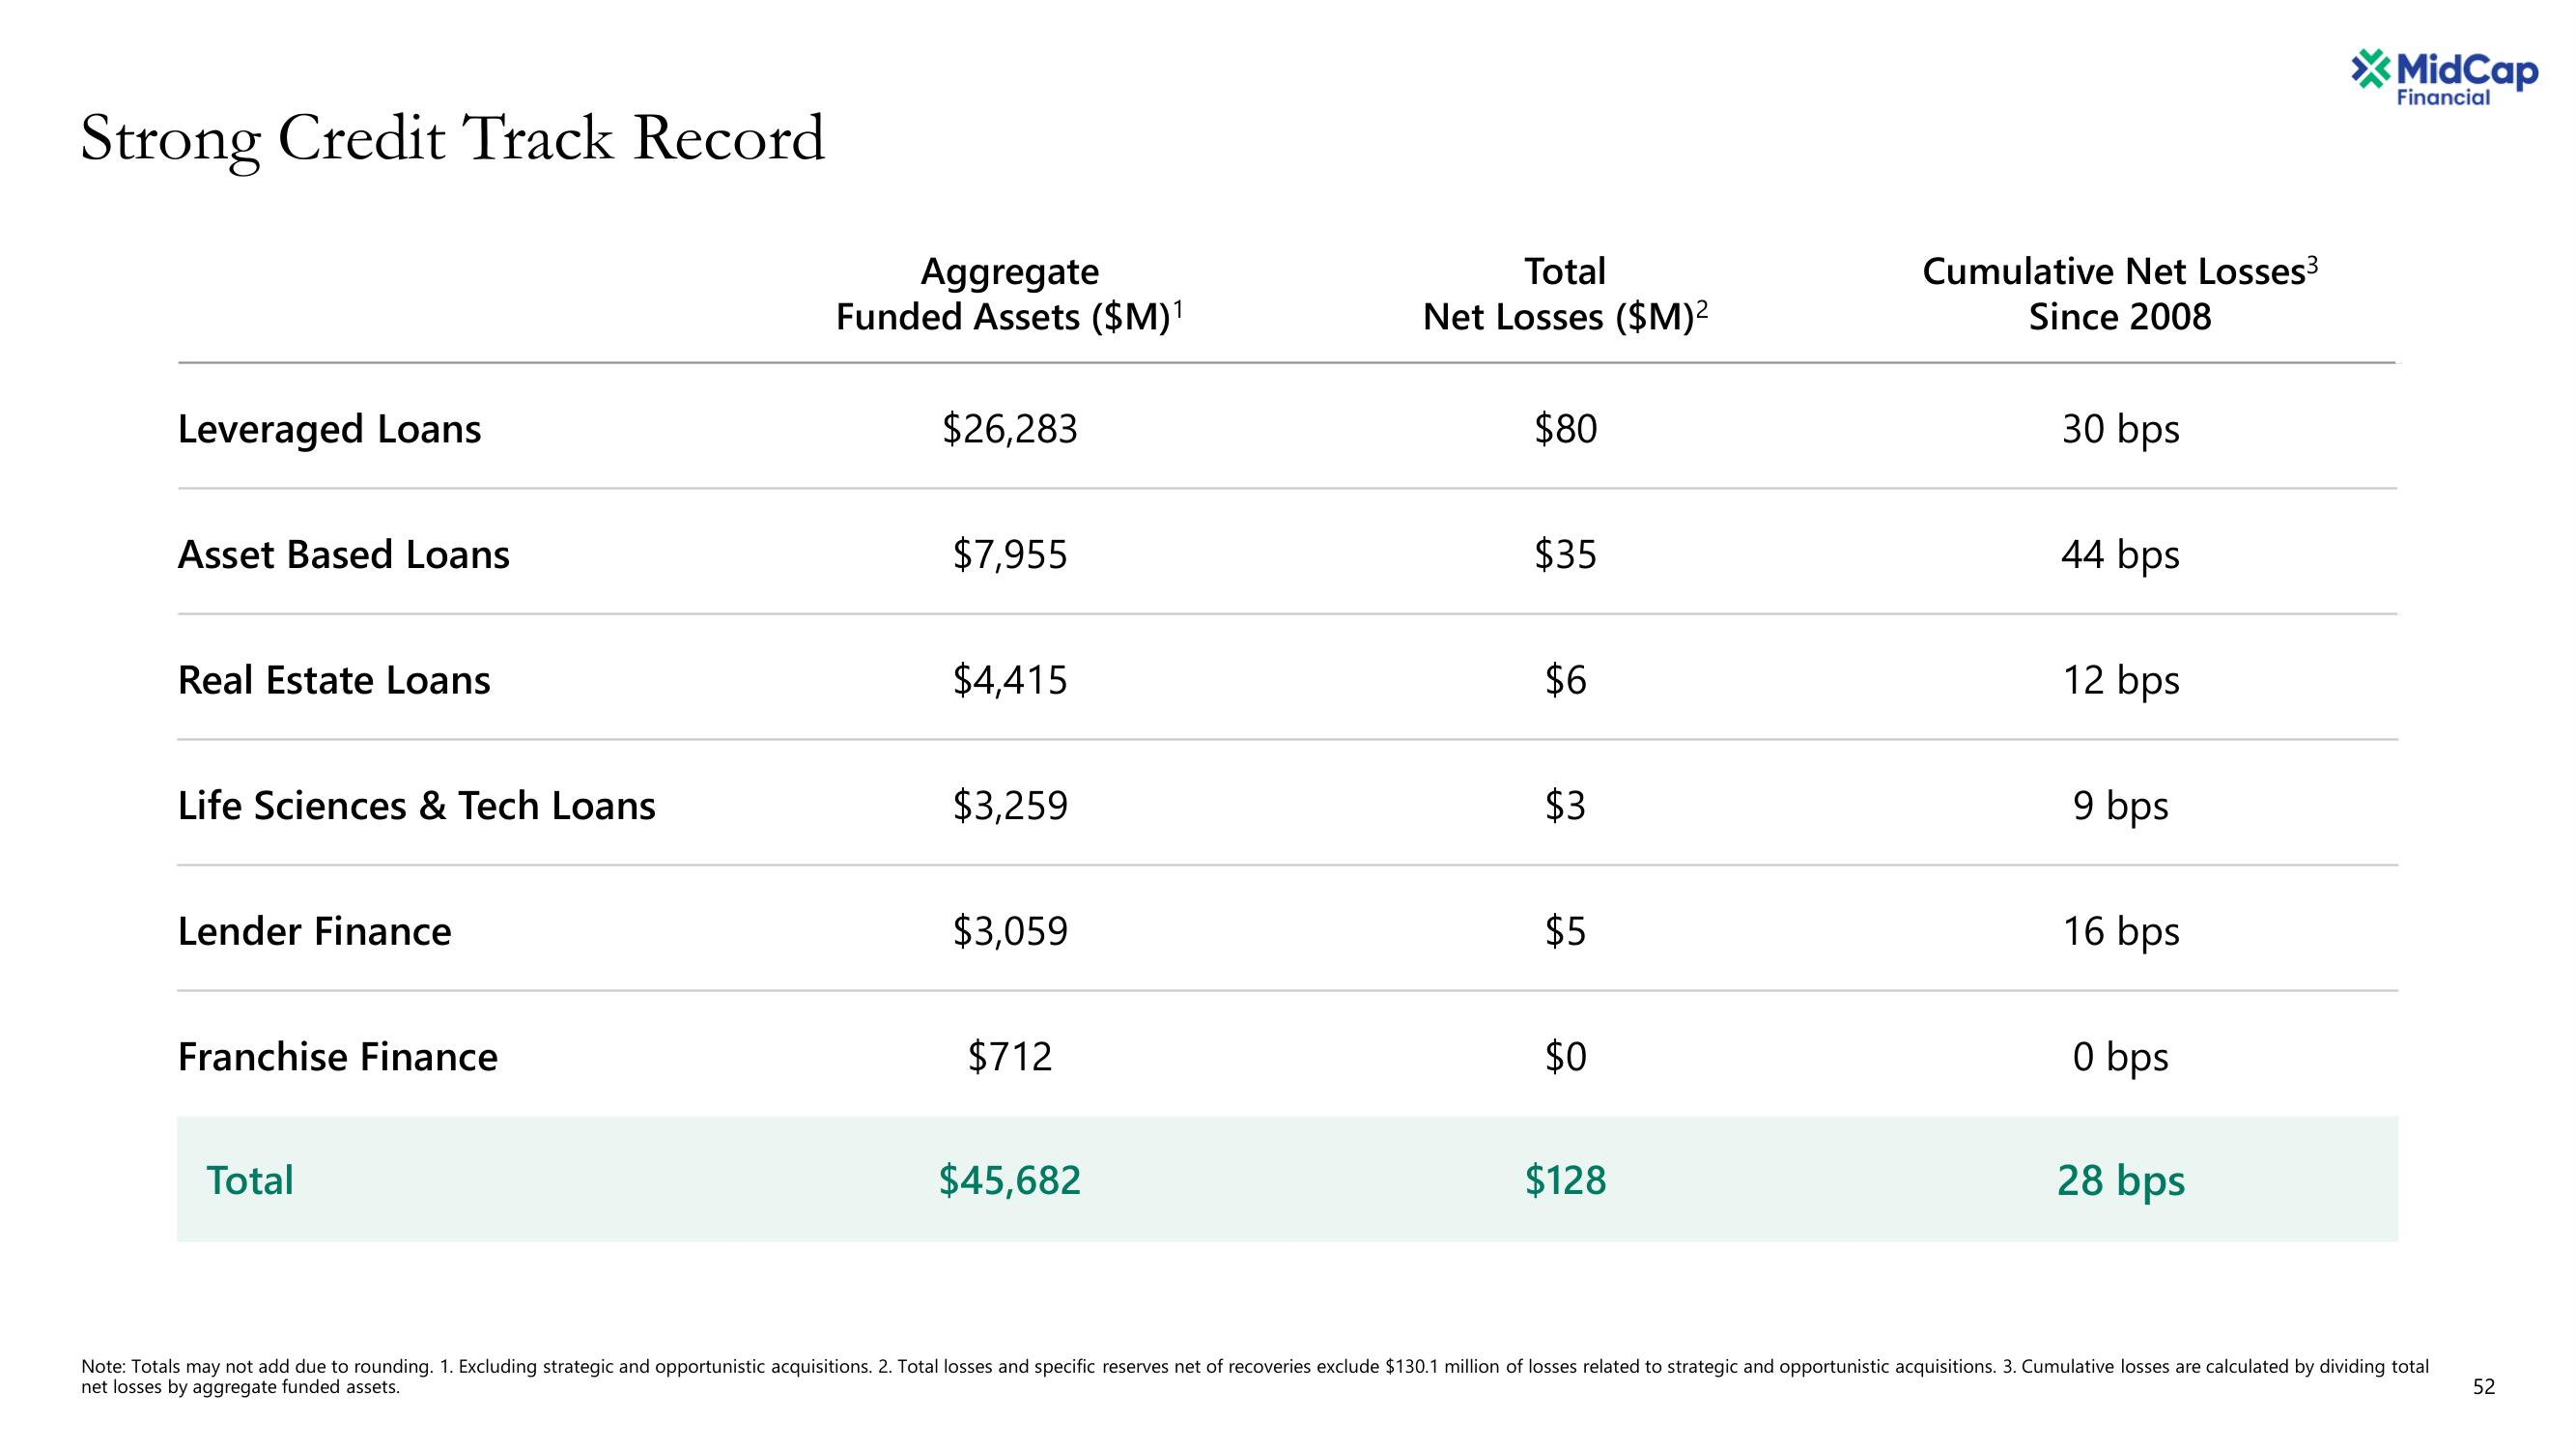
Strong Credit Track Record Leveraged Loans Asset Based Loans Real Estate Loans Life Sciences & Tech Loans Lender Finance Franchise Finance Total Aggregate Funded Assets ($M)¹ $26,283 $7,955 $4,415 $3,259 $3,059 $712 $45,682 Total Net Losses ($M)² $80 $35 $6 $3 $5 $0 $128 Cumulative Net Losses³ Since 2008 30 bps 44 bps 12 bps 9 bps 16 bps 0 bps 28 bps *MidCap Financial Note: Totals may not add due to rounding. 1. Excluding strategic and opportunistic acquisitions. 2. Total losses and specific reserves net of recoveries exclude $130.1 million of losses related to strategic and opportunistic acquisitions. 3. Cumulative losses are calculated by dividing total net losses by aggregate funded assets. 52
View entire presentation