Credit Suisse Investment Banking Pitch Book
CONFIDENTIAL
S
I
eta
200 MM.
How
M
Comparable Company Multiple Analysis
FUNSHO
HOPE
ETD)
th
www
Mas
Sear
CHE DW)
Fate
Astodia Ce
Fawx Cell
Fou
Peer Group Comparables
58-4)
1541
Xw
2.18
OH
364
59
38.72
1000
4309
#a
16:22
110
CREDIT FIRST
SUISSE BOSTON
thành
1407
LOME
AT W
34.300
1392
140
194
AME
N
LKD
at NY
1218
W
NY
Fer
MA
44
M.K
439
82
11.30
14.3
FAIR MT
RH
21.00
424371
4406
4.000
138
MAM
LAM
954
300
M.A
STA
10 k
M
2....
MI
ND
27 SH
3D
W.Y
2N
2N
20
1.N
e
14
of
KUPA
1.2
1.18
8TH
13
124
4.24
1h
22
2.1
8TH
CM
14
21a
3.N
2.24
9.5
43
AN
C
C
12
TEM
ADM
TM
143
wis
9.2
"N
IN
5.
KG
SN
In
346
6F
HA
IN
In
756
VA
YA
17
21%
CTM
LIN
IN
Mey
2.M
38
TEEN
in
AM
RIGH
H.P
9.3
ETN
49
1264 1319
34%
7074
529
49
HEIN
18.48 un
LA
49
PRIN
226 1226
8.56
418
MIS
M
1429
LON
2018
539 1699
LETS
12
3415
1716
HIS
CAN
MEN
140% 1928
2414
2020
an
un
3A
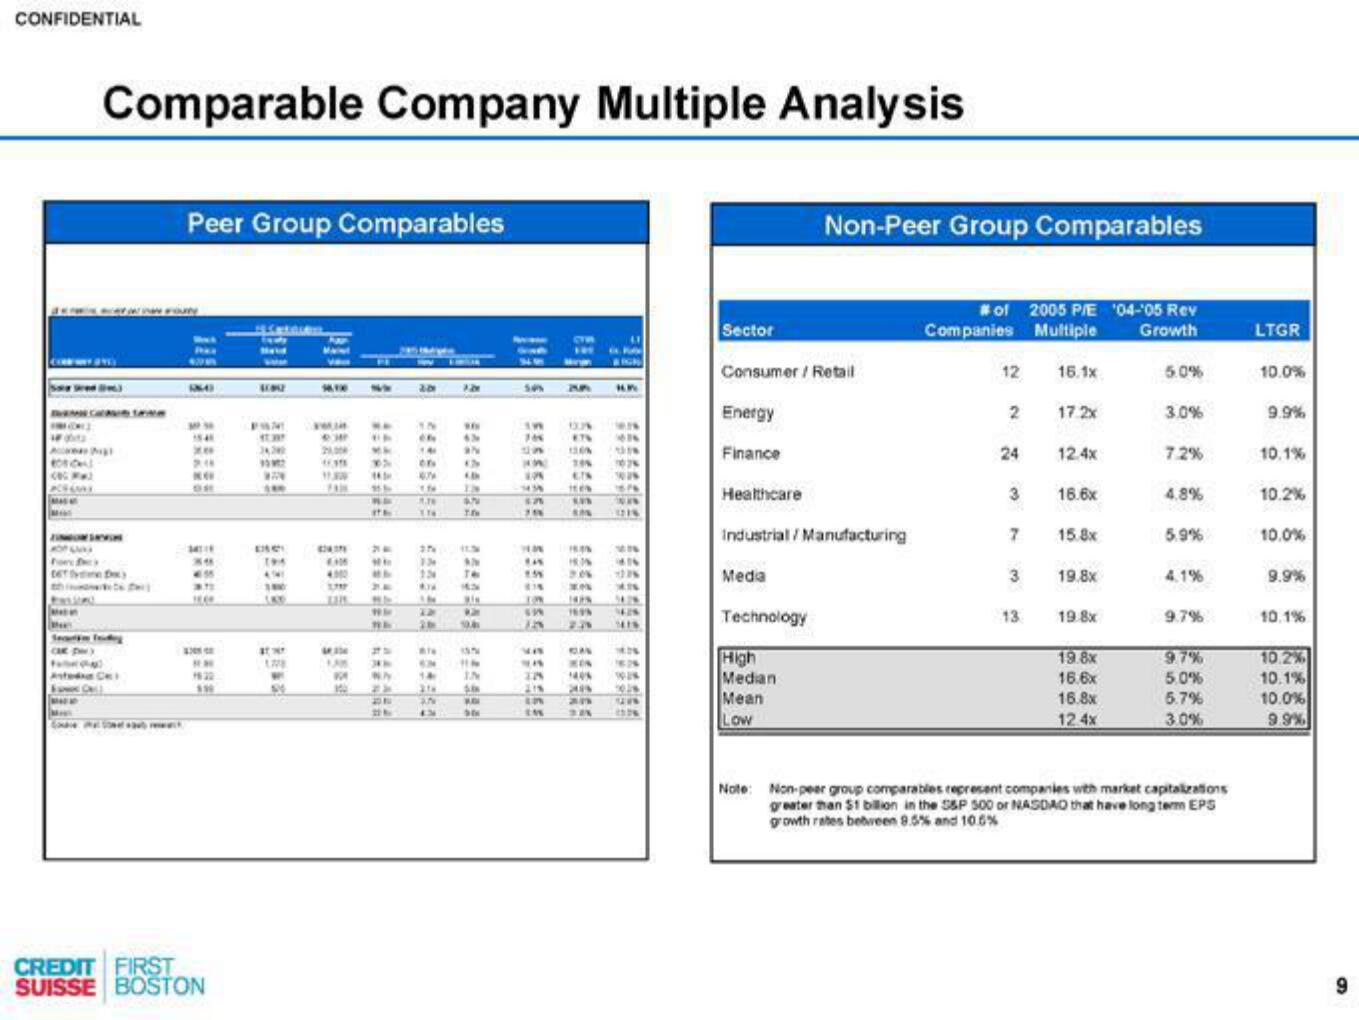
Sector
Consumer/Retail
Energy
Finance
Healthcare
Industrial/Manufacturing
Media
Non-Peer Group Comparables
Technology
High
Median
Mean
Low
# of 2005 P/E '04-'05 Rev
Companies Multiple Growth
12
2
24
3
7
3
13
16.1x
17.2x
12.4x
16.6x
15.8x
19.8x
19.8x
19.8x
16.6x
16.8x
12.4x
5.0%
3.0%
7.2%
4.8%
5.9%
4.1%
9.7%
9.7%
5.0%
5.7%
3.0%
Note: Non-peer group comparables represent companies with market capitalizations
greater than $1 billion in the S&P 500 or NASDAQ that have long term EPS
growth rates between 9.5% and 10.5%
LTGR
10.0%
9.9%
10.1%
10.2%
10.0%
9.9%
10.1%
10.2%
10.1%
10.0%
9.9%
9View entire presentation