HSBC Investor Event Presentation Deck
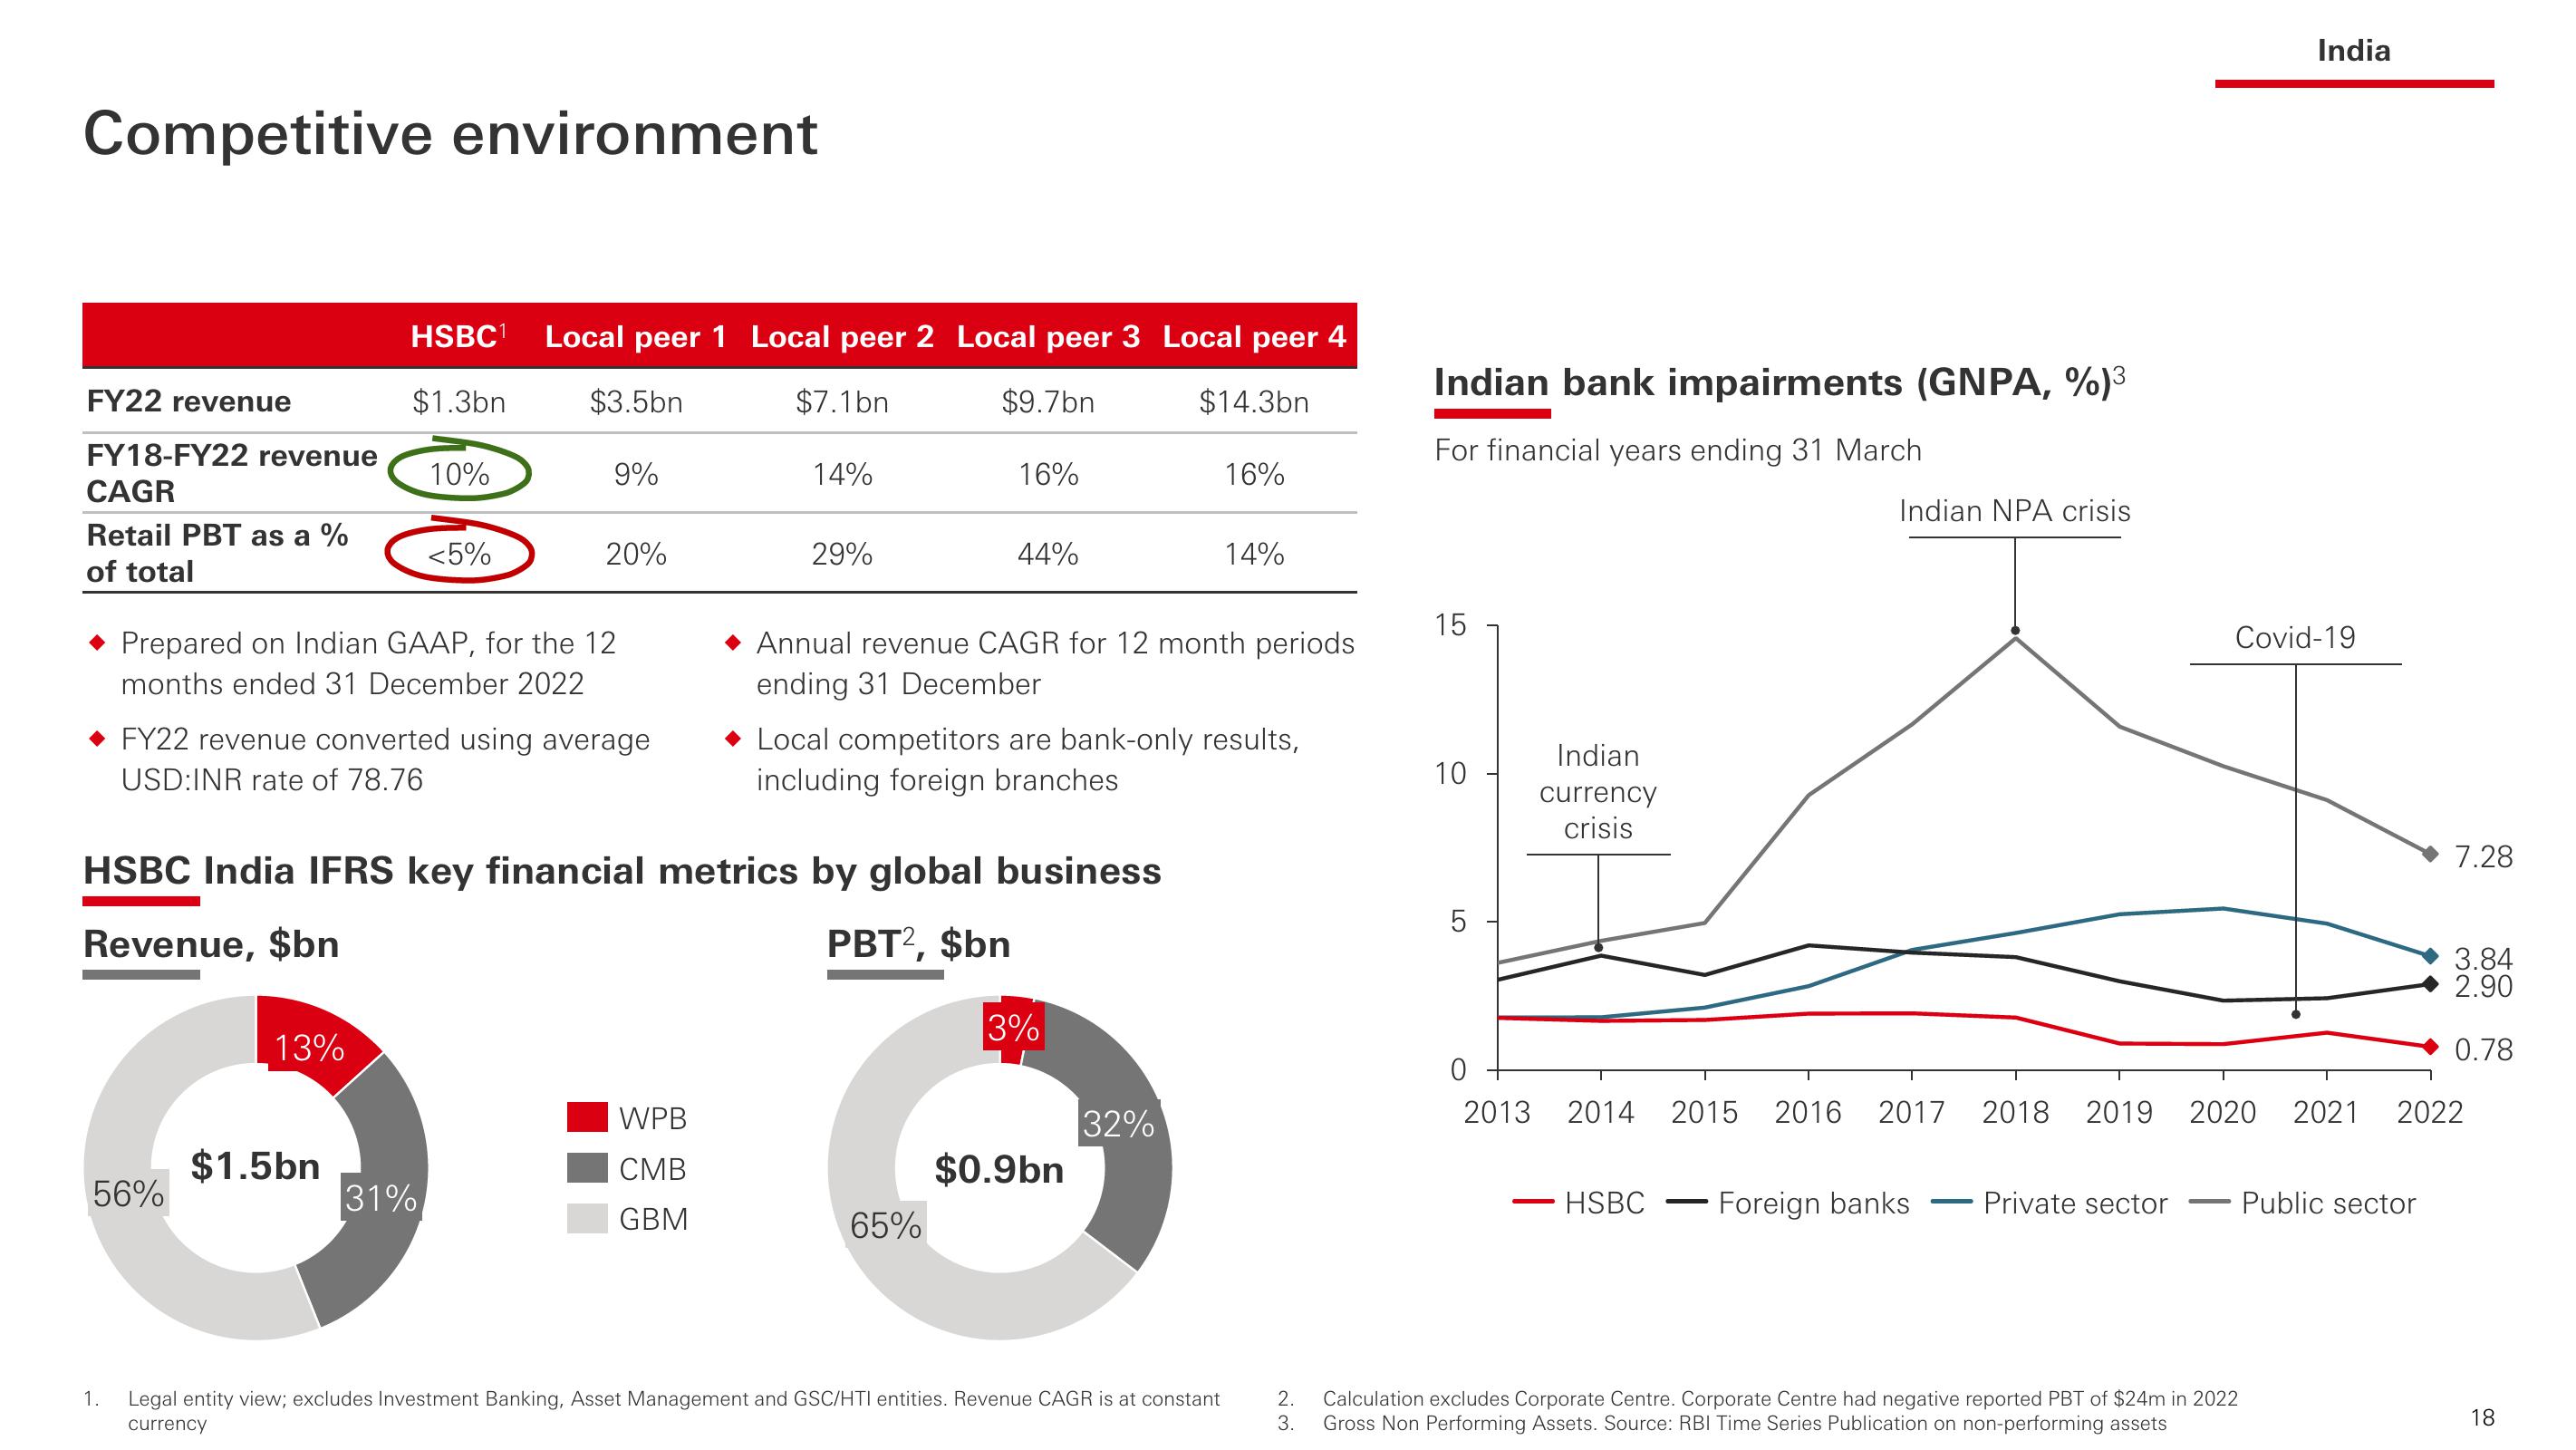
Competitive environment
FY22 revenue
FY18-FY22 revenue
CAGR
Retail PBT as a %
of total
56%
1.
HSBC¹ Local peer 1 Local peer 2 Local peer 3 Local peer 4
$1.3bn
$3.5bn
$7.1bn
$9.7bn
$14.3bn
13%
10%
Prepared on Indian GAAP, for the 12
months ended 31 December 2022
◆ FY22 revenue converted using average
USD:INR rate of 78.76
$1.5bn
<5%
31%
9%
20%
14%
HSBC India IFRS key financial metrics by global business
Revenue, $bn
PBT2, $bn
WPB
CMB
GBM
29%
16%
44%
65%
Annual revenue CAGR for 12 month periods
ending 31 December
Local competitors are bank-only results,
including foreign branches
3%
$0.9bn
16%
32%
14%
Legal entity view; excludes Investment Banking, Asset Management and GSC/HTI entities. Revenue CAGR is at constant
currency
2.
3.
Indian bank impairments (GNPA, %)³
For financial years ending 31 March
15
10
5
0
2013
Indian
currency
crisis
2014 2015 2016
HSBC
Indian NPA crisis
Foreign banks
2017 2018 2019 2020 2021
Private sector
India
Covid-19
Calculation excludes Corporate Centre. Corporate Centre had negative reported PBT of $24m in 2022
Gross Non Performing Assets. Source: RBI Time Series Publication on non-performing assets
7.28
Public sector
3.84
2.90
0.78
2022
18View entire presentation