Toyota Investor Presentation Deck
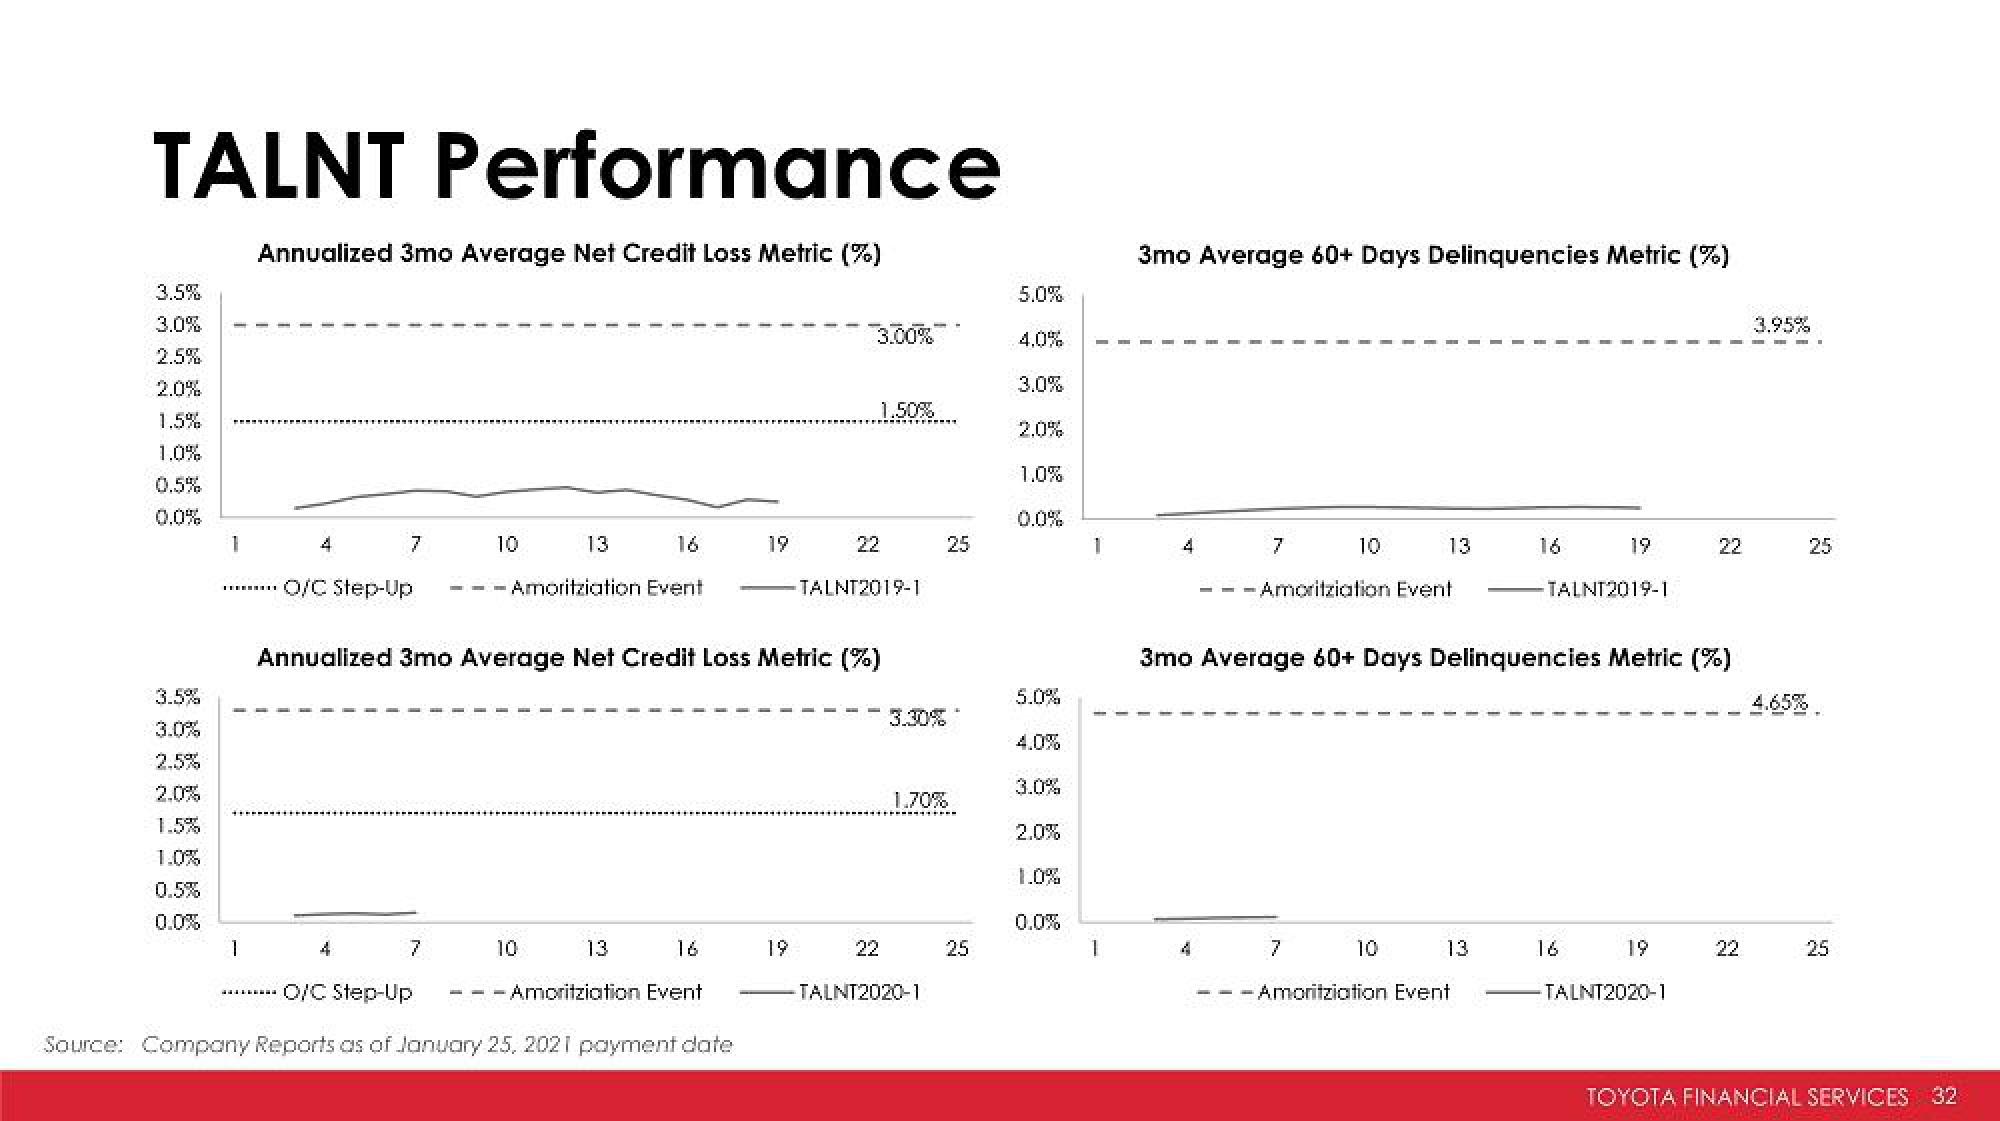
TALNT Performance
Annualized 3mo Average Net Credit Loss Metric (%)
3.5%
3.0%
2.5%
2.0%
1.5%
1.0%
0.5%
0.0%
3.5%
3.0%
2.5%
2.0%
1.0%
0.5%
0.0%
1
………………………
1
4
*********
7
O/C Step-Up ---Amoritziation Event
4
13
7
10
Annualized 3mo Average Net Credit Loss Metric (%)
13
16
O/C Step-Up
Source: Company Reports as of January 25, 2021 payment date
19
-- Amoritziation Event
3.00%
19
1.50%
22
-TALNT2019-1
3.30%
25
1.70%
22
-TALNT2020-1
25
5.0%
4.0%
3.0%
2.0%
1.0%
0.0%
5.0%
4.0%
3.0%
2.0%
1.0%
0.0%
1
1
3mo Average 60+ Days Delinquencies Metric (%)
4
7
4
10.
13
---Amoritziation Event
10
13
16
3mo Average 60+ Days Delinquencies Metric (%)
--Amoritziation Event
19
-TALNT2019-1
16
19
22
TALNT2020-1
22
3.95%
25
25
TOYOTA FINANCIAL SERVICES 32View entire presentation