Investor Presentation
ENERGY & CLIMATE TECHNOLOGIES
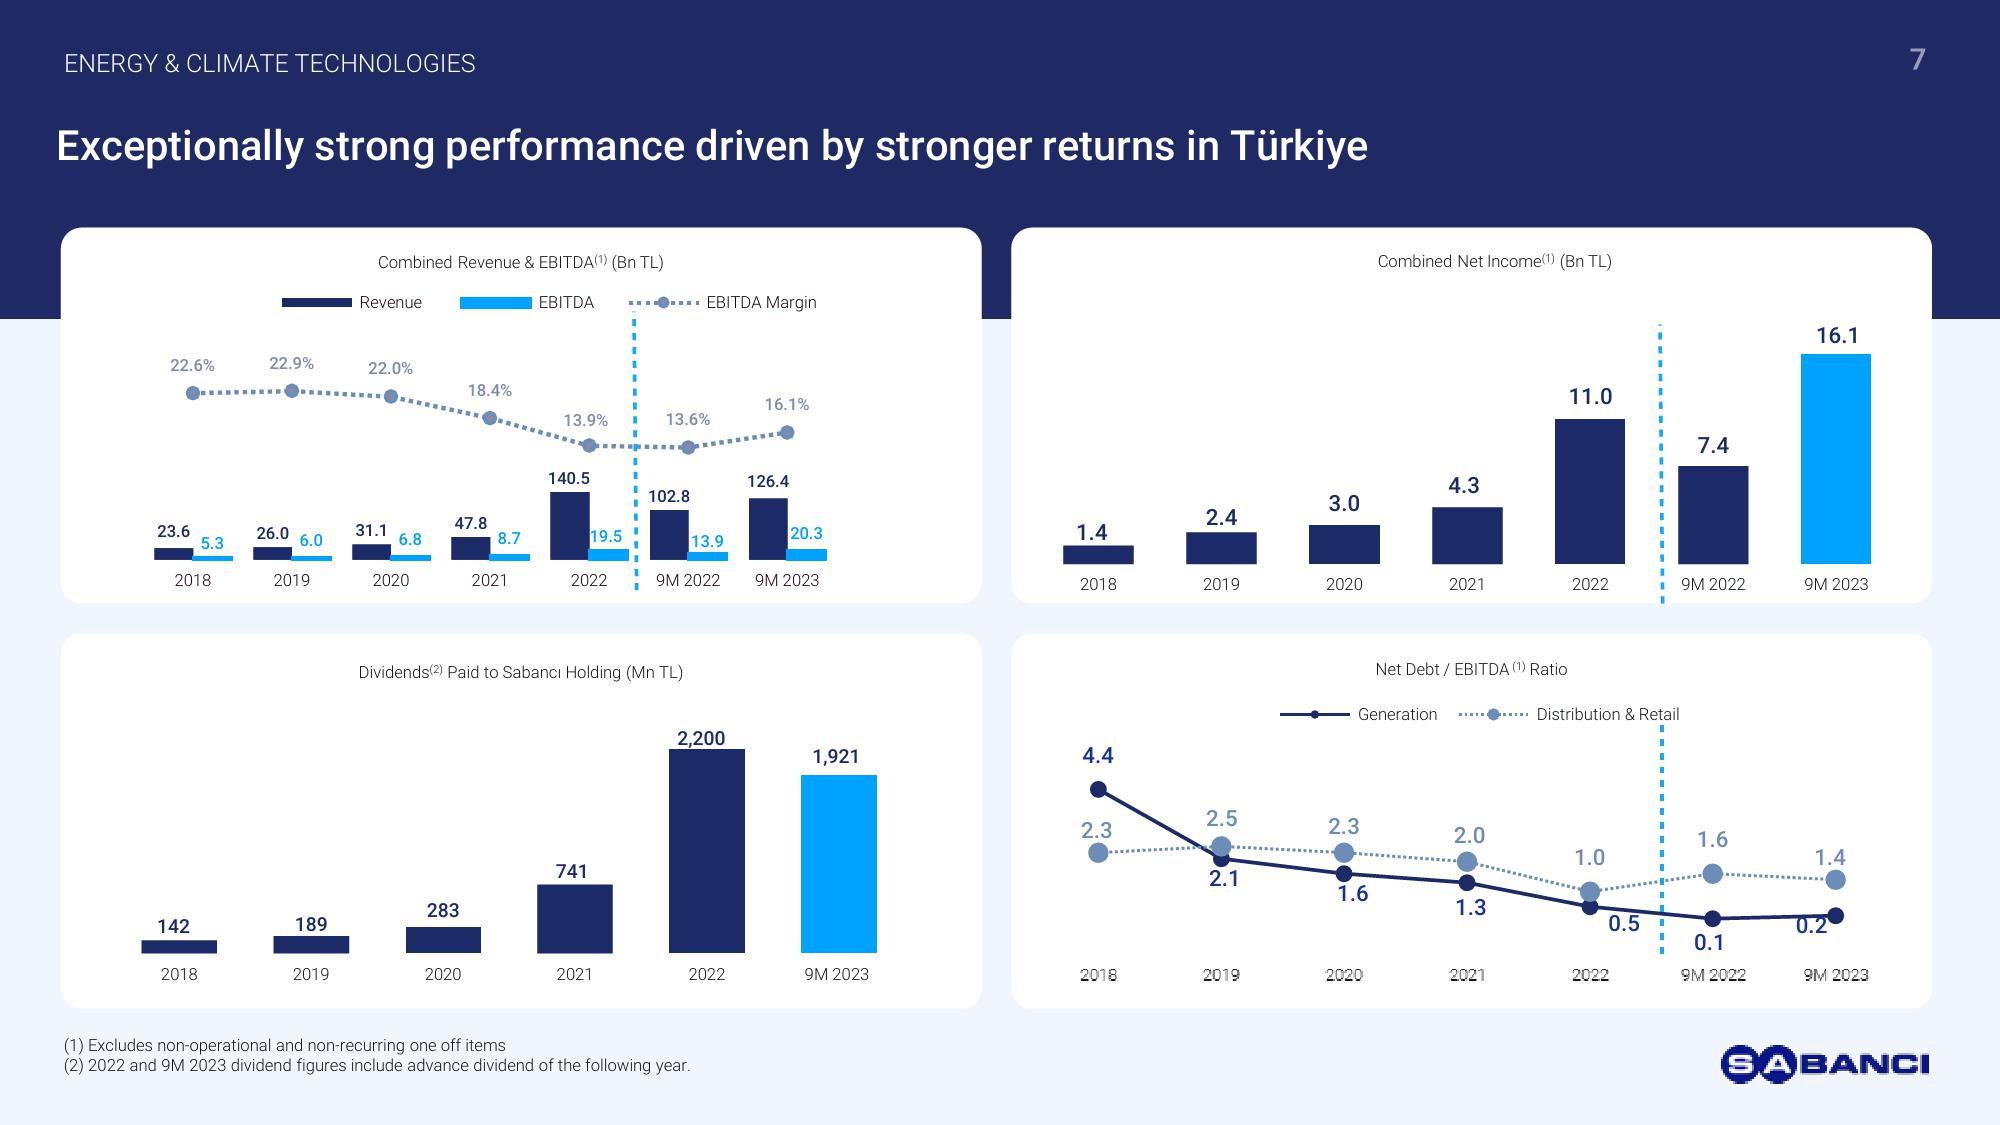
Exceptionally strong performance driven by stronger returns in Türkiye
Combined Revenue & EBITDA (1) (Bn TL)
Revenue
EBITDA
EBITDA Margin
22.6%
22.9%
22.0%
18.4%
16.1%
13.9%
13.6%
Combined Net Income(1) (Bn TL)
11.0
7.4
16.1
140.5
126.4
102.8
47.8
23.6
26.0
31.1
5.3
6.0
6.8
8.7
19.5
4.3
3.0
2.4
20.3
1.4
13.9
2018
2019
2020
2021
2022
9M 2022
9M 2023
2018
2019
2020
2021
2022
9M 2022
9M 2023
Dividends(2) Paid to Sabancı Holding (Mn TL)
2,200
1,921
4.4
Net Debt/EBITDA (1) Ratio
Generation
Distribution & Retail
741
283
142
189
2.5
2.3
2.3
2.0
1.6
1.0
1.4
2.1
1.6
1.3
0.5
0.2
0.1
2018
2019
2020
2021
2022
9M 2023
2018
2019
2020
2021
2022
9M 2022
9M 2023
(1) Excludes non-operational and non-recurring one off items
(2) 2022 and 9M 2023 dividend figures include advance dividend of the following year.
7
SABANCIView entire presentation