Lyft Results Presentation Deck
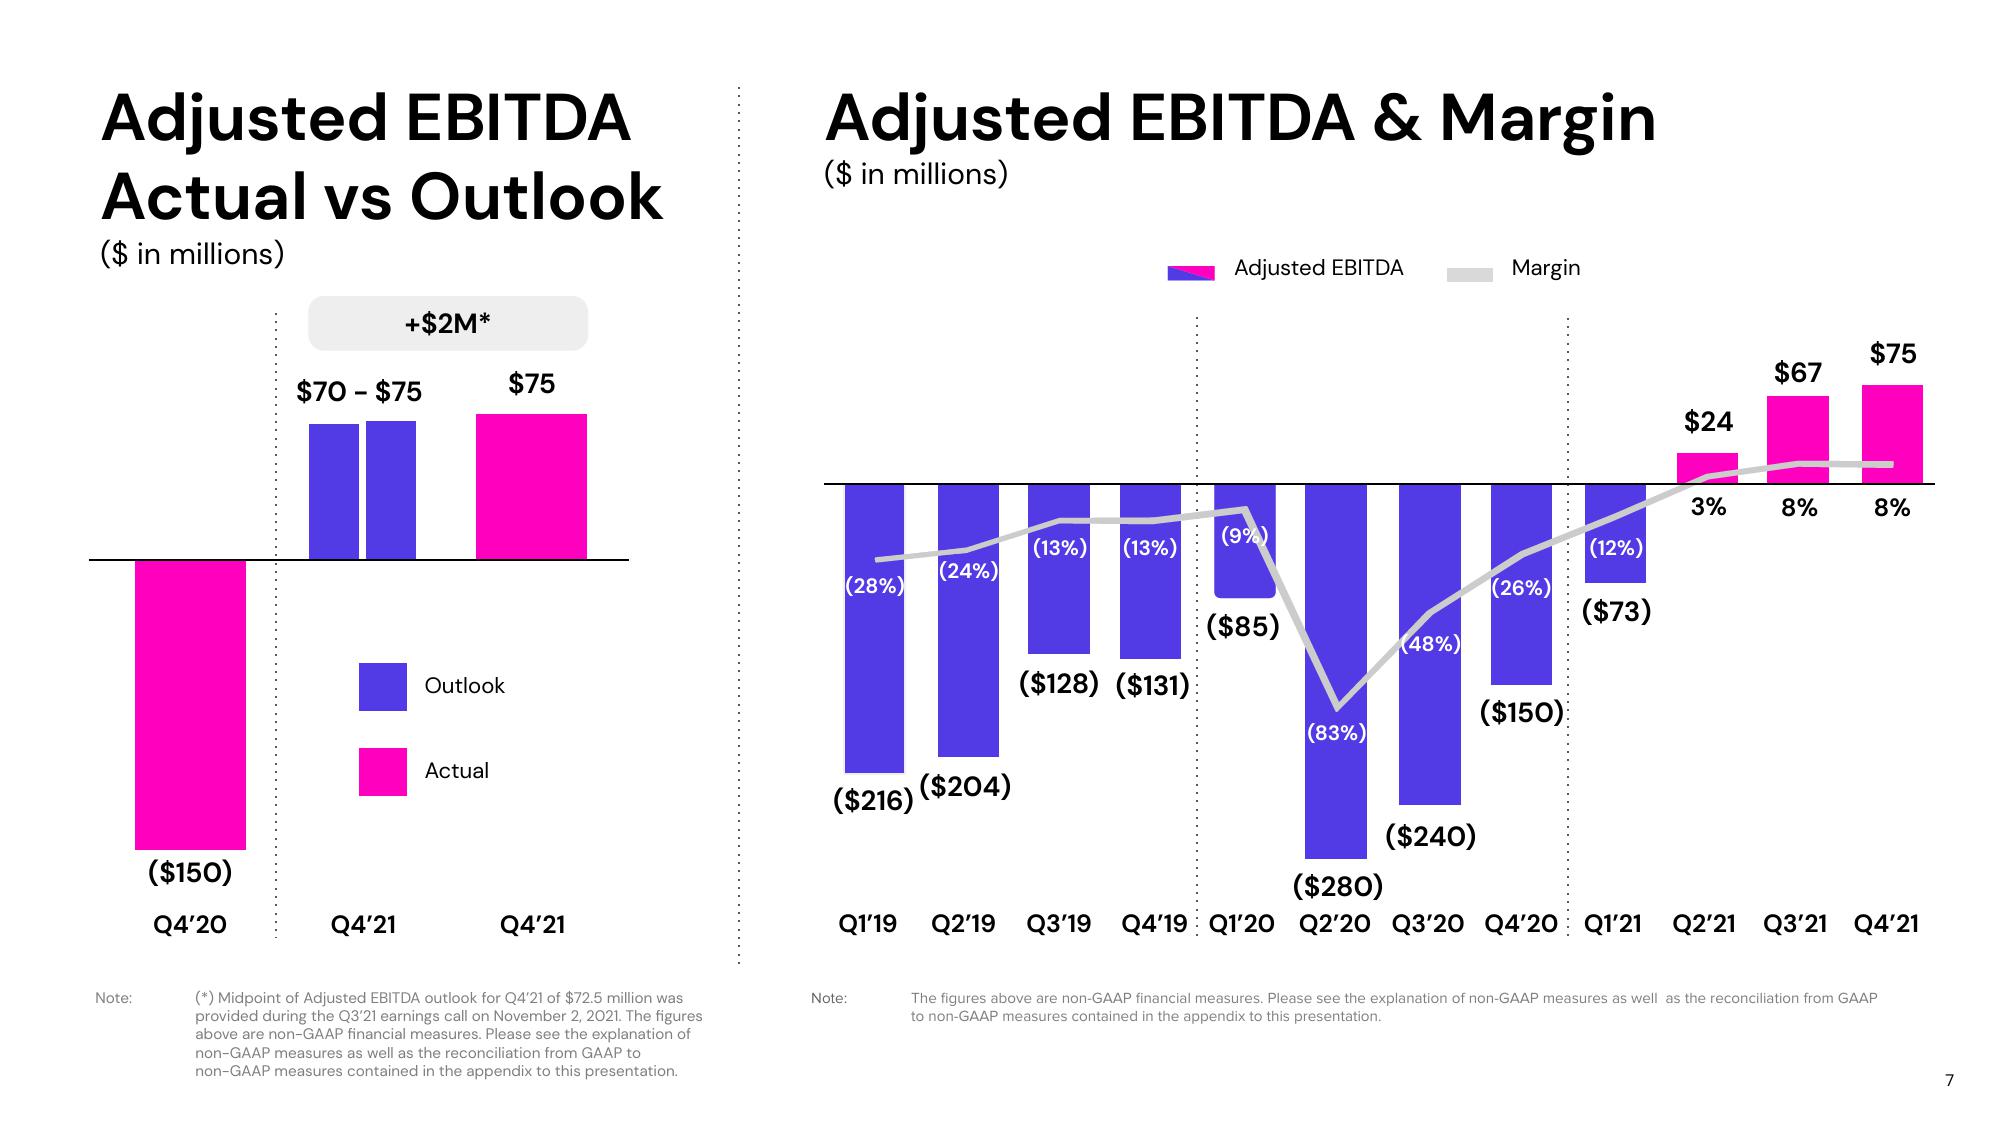
Adjusted EBITDA
Actual vs Outlook
($ in millions)
Note:
($150)
Q4'20
+$2M*
$70 - $75
Q4'21
Outlook
Actual
$75
Q4'21
(*) Midpoint of Adjusted EBITDA outlook for Q4'21 of $72.5 million was
provided during the Q3'21 earnings call on November 2, 2021. The figures
above are non-GAAP financial measures. Please see the explanation of
non-GAAP measures as well as the reconciliation from GAAP to
non-GAAP measures contained in the appendix to this presentation.
Adjusted EBITDA & Margin
($ in millions)
(28%)
H
($216)
Q1'19
Note:
(24%)
($204)
(13%) (13%)
($128) ($131)
Adjusted EBITDA
(9%)
($85)
(83%)
(48%)
($240)
Margin
(26%)
($150)
(12%)
($73)
$24
3%
$67
8%
$75
8%
($280)
Q2'19 Q3'19 Q4'19 Q1'20 Q2'20 Q3'20 Q4'20 Q1'21 Q2'21 Q3'21 Q4'21
The figures above are non-GAAP financial measures. Please see the explanation of non-GAAP measures as well as the reconciliation from GAAP
to non-GAAP measures contained in the appendix to this presentation.
7View entire presentation