AMC Investor Presentation Deck
Appendix
amc
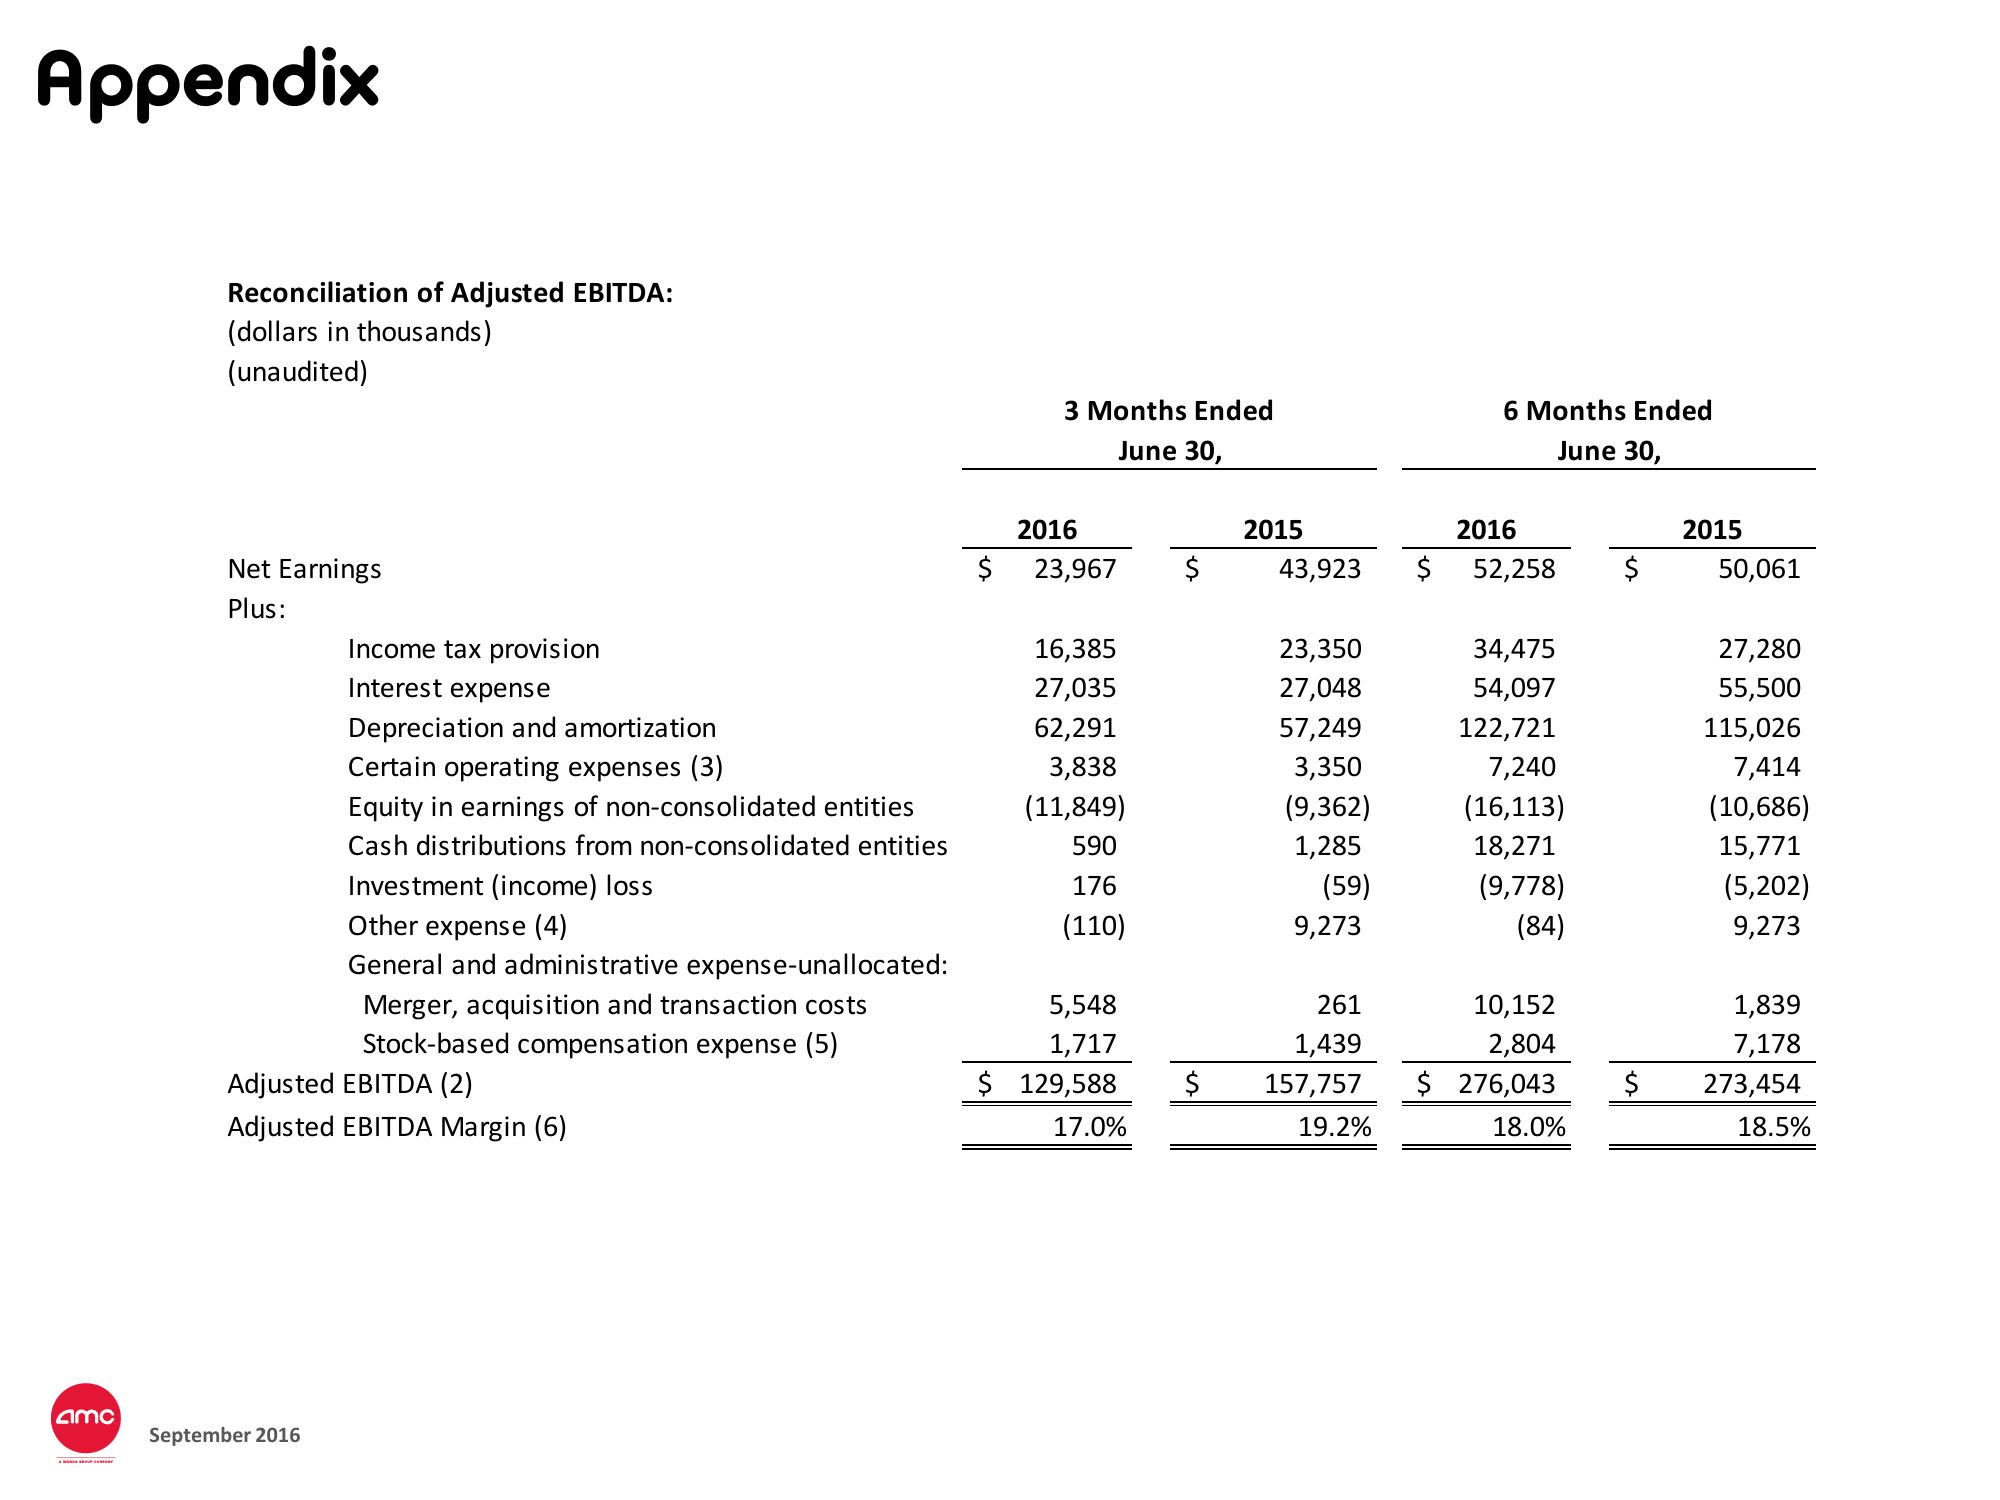
Reconciliation of Adjusted EBITDA:
(dollars in thousands)
(unaudited)
Net Earnings
Plus:
Income tax provision
Interest expense
September 2016
Depreciation and amortization
Certain operating expenses (3)
Equity in earnings of non-consolidated entities
Cash distributions from non-consolidated entities
Investment (income) loss
Other expense (4)
General and administrative expense-unallocated:
Merger, acquisition and transaction costs
Stock-based compensation expense (5)
Adjusted EBITDA (2)
Adjusted EBITDA Margin (6)
$
3 Months Ended
June 30,
2016
23,967
16,385
27,035
62,291
3,838
(11,849)
590
176
(110)
5,548
1,717
$ 129,588
17.0%
$
$
2015
43,923
23,350
27,048
57,249
3,350
(9,362)
1,285
(59)
9,273
261
1,439
157,757
19.2%
6 Months Ended
June 30,
2016
$ 52,258 $
34,475
54,097
122,721
7,240
(16,113)
18,271
(9,778)
(84)
10,152
2,804
$ 276,043
18.0%
$
2015
50,061
27,280
55,500
115,026
7,414
(10,686)
15,771
(5,202)
9,273
1,839
7,178
273,454
18.5%View entire presentation