Deutsche Bank Results Presentation Deck
Key performance indicators
In %
>
>
>
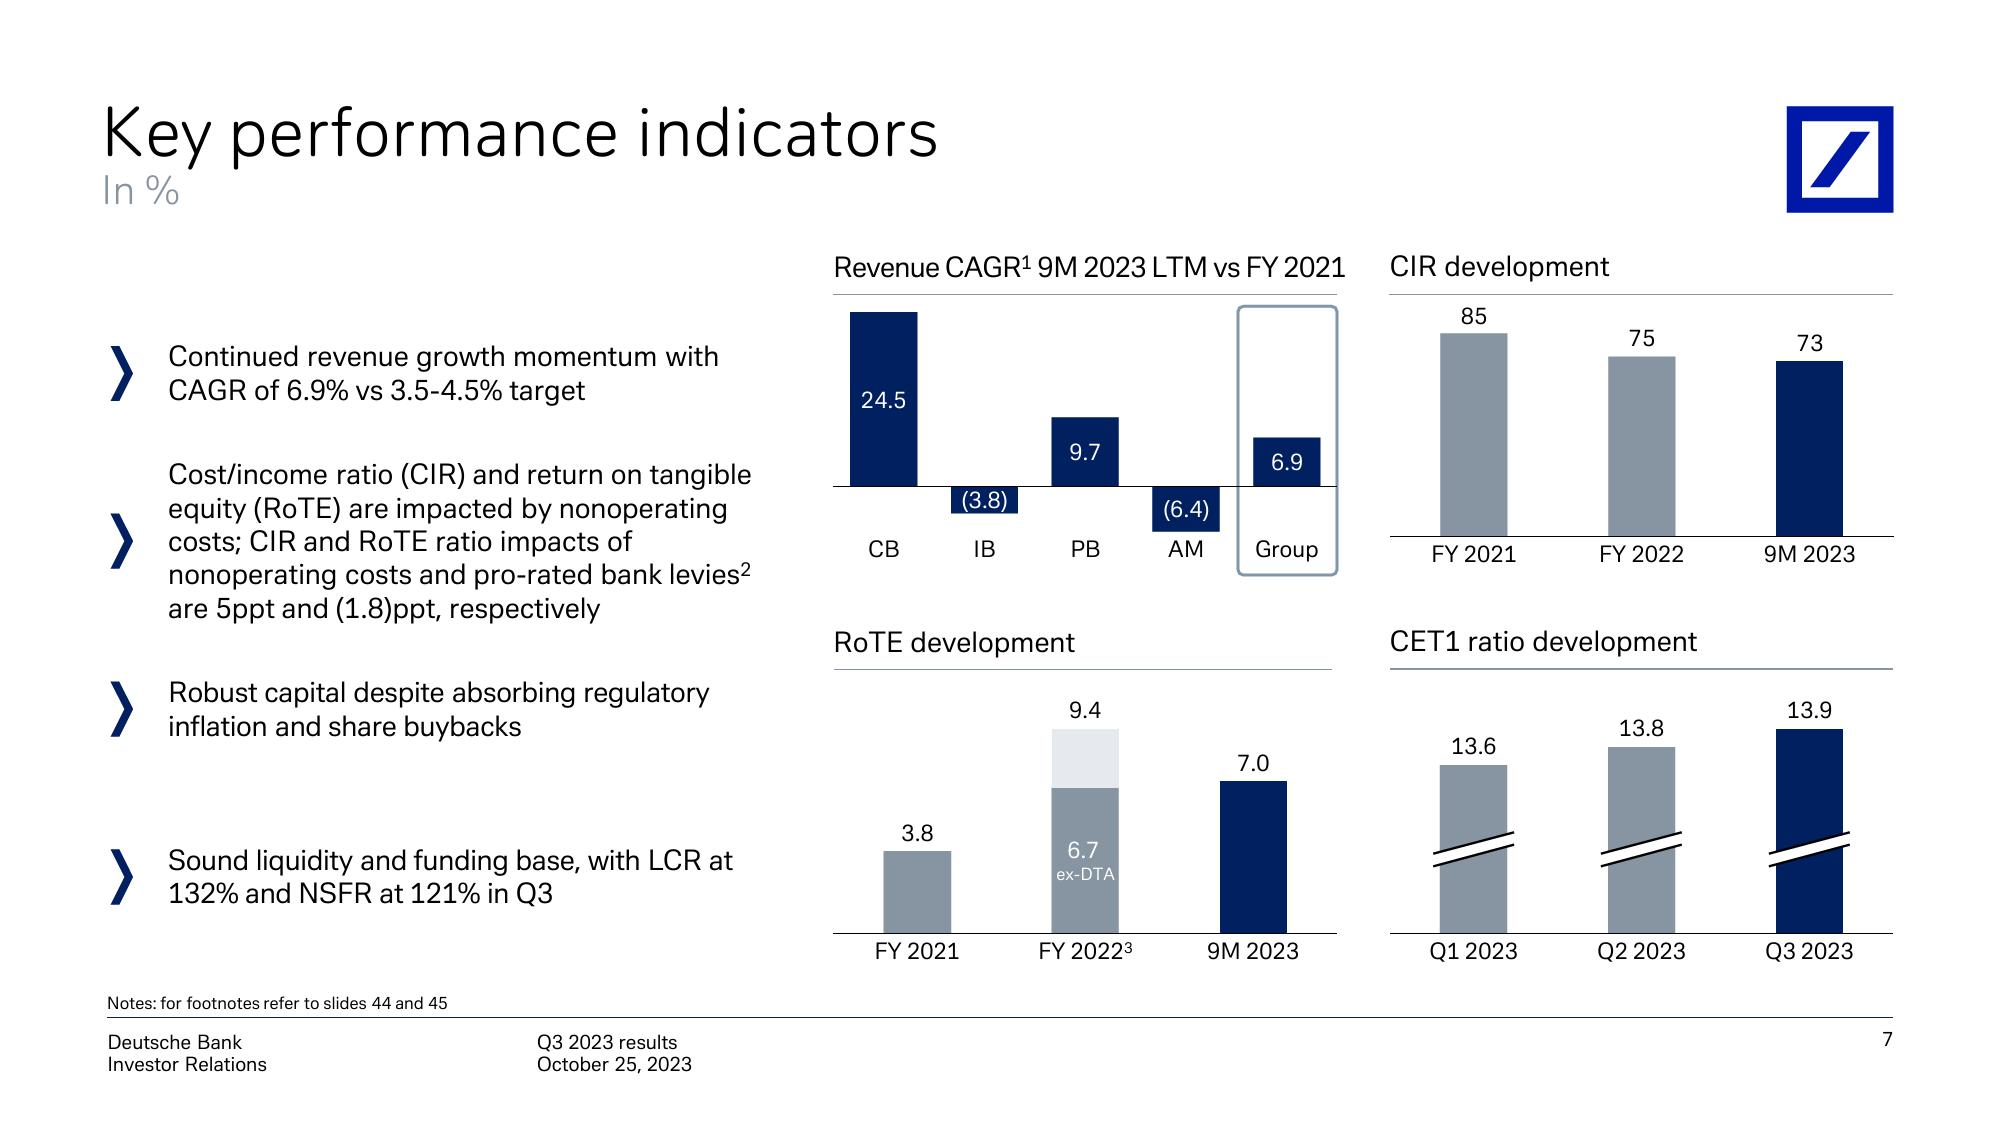
Continued revenue growth momentum with
CAGR of 6.9% vs 3.5-4.5% target
Cost/income ratio (CIR) and return on tangible
equity (RoTE) are impacted by nonoperating
costs; CIR and ROTE ratio impacts of
nonoperating costs and pro-rated bank levies²
are 5ppt and (1.8)ppt, respectively
Robust capital despite absorbing regulatory
inflation and share buybacks
Sound liquidity and funding base, with LCR at
132% and NSFR at 121% in Q3
Notes: for footnotes refer to slides 44 and 45
Deutsche Bank
Investor Relations
Q3 2023 results
October 25, 2023
Revenue CAGR¹ 9M 2023 LTM vs FY 2021
24.5
CB
3.8
(3.8)
IB
FY 2021
9.7
ROTE development
PB
9.4
6.7
ex-DTA
FY 20223
(6.4)
AM
6.9
Group
7.0
9M 2023
CIR development
85
FY 2021
13.6
75
CET1 ratio development
Q1 2023
FY 2022
13.8
Q2 2023
/
73
9M 2023
13.9
Q3 2023
7View entire presentation