First Quarter 2023 Earnings Conference Call
Operating Performance
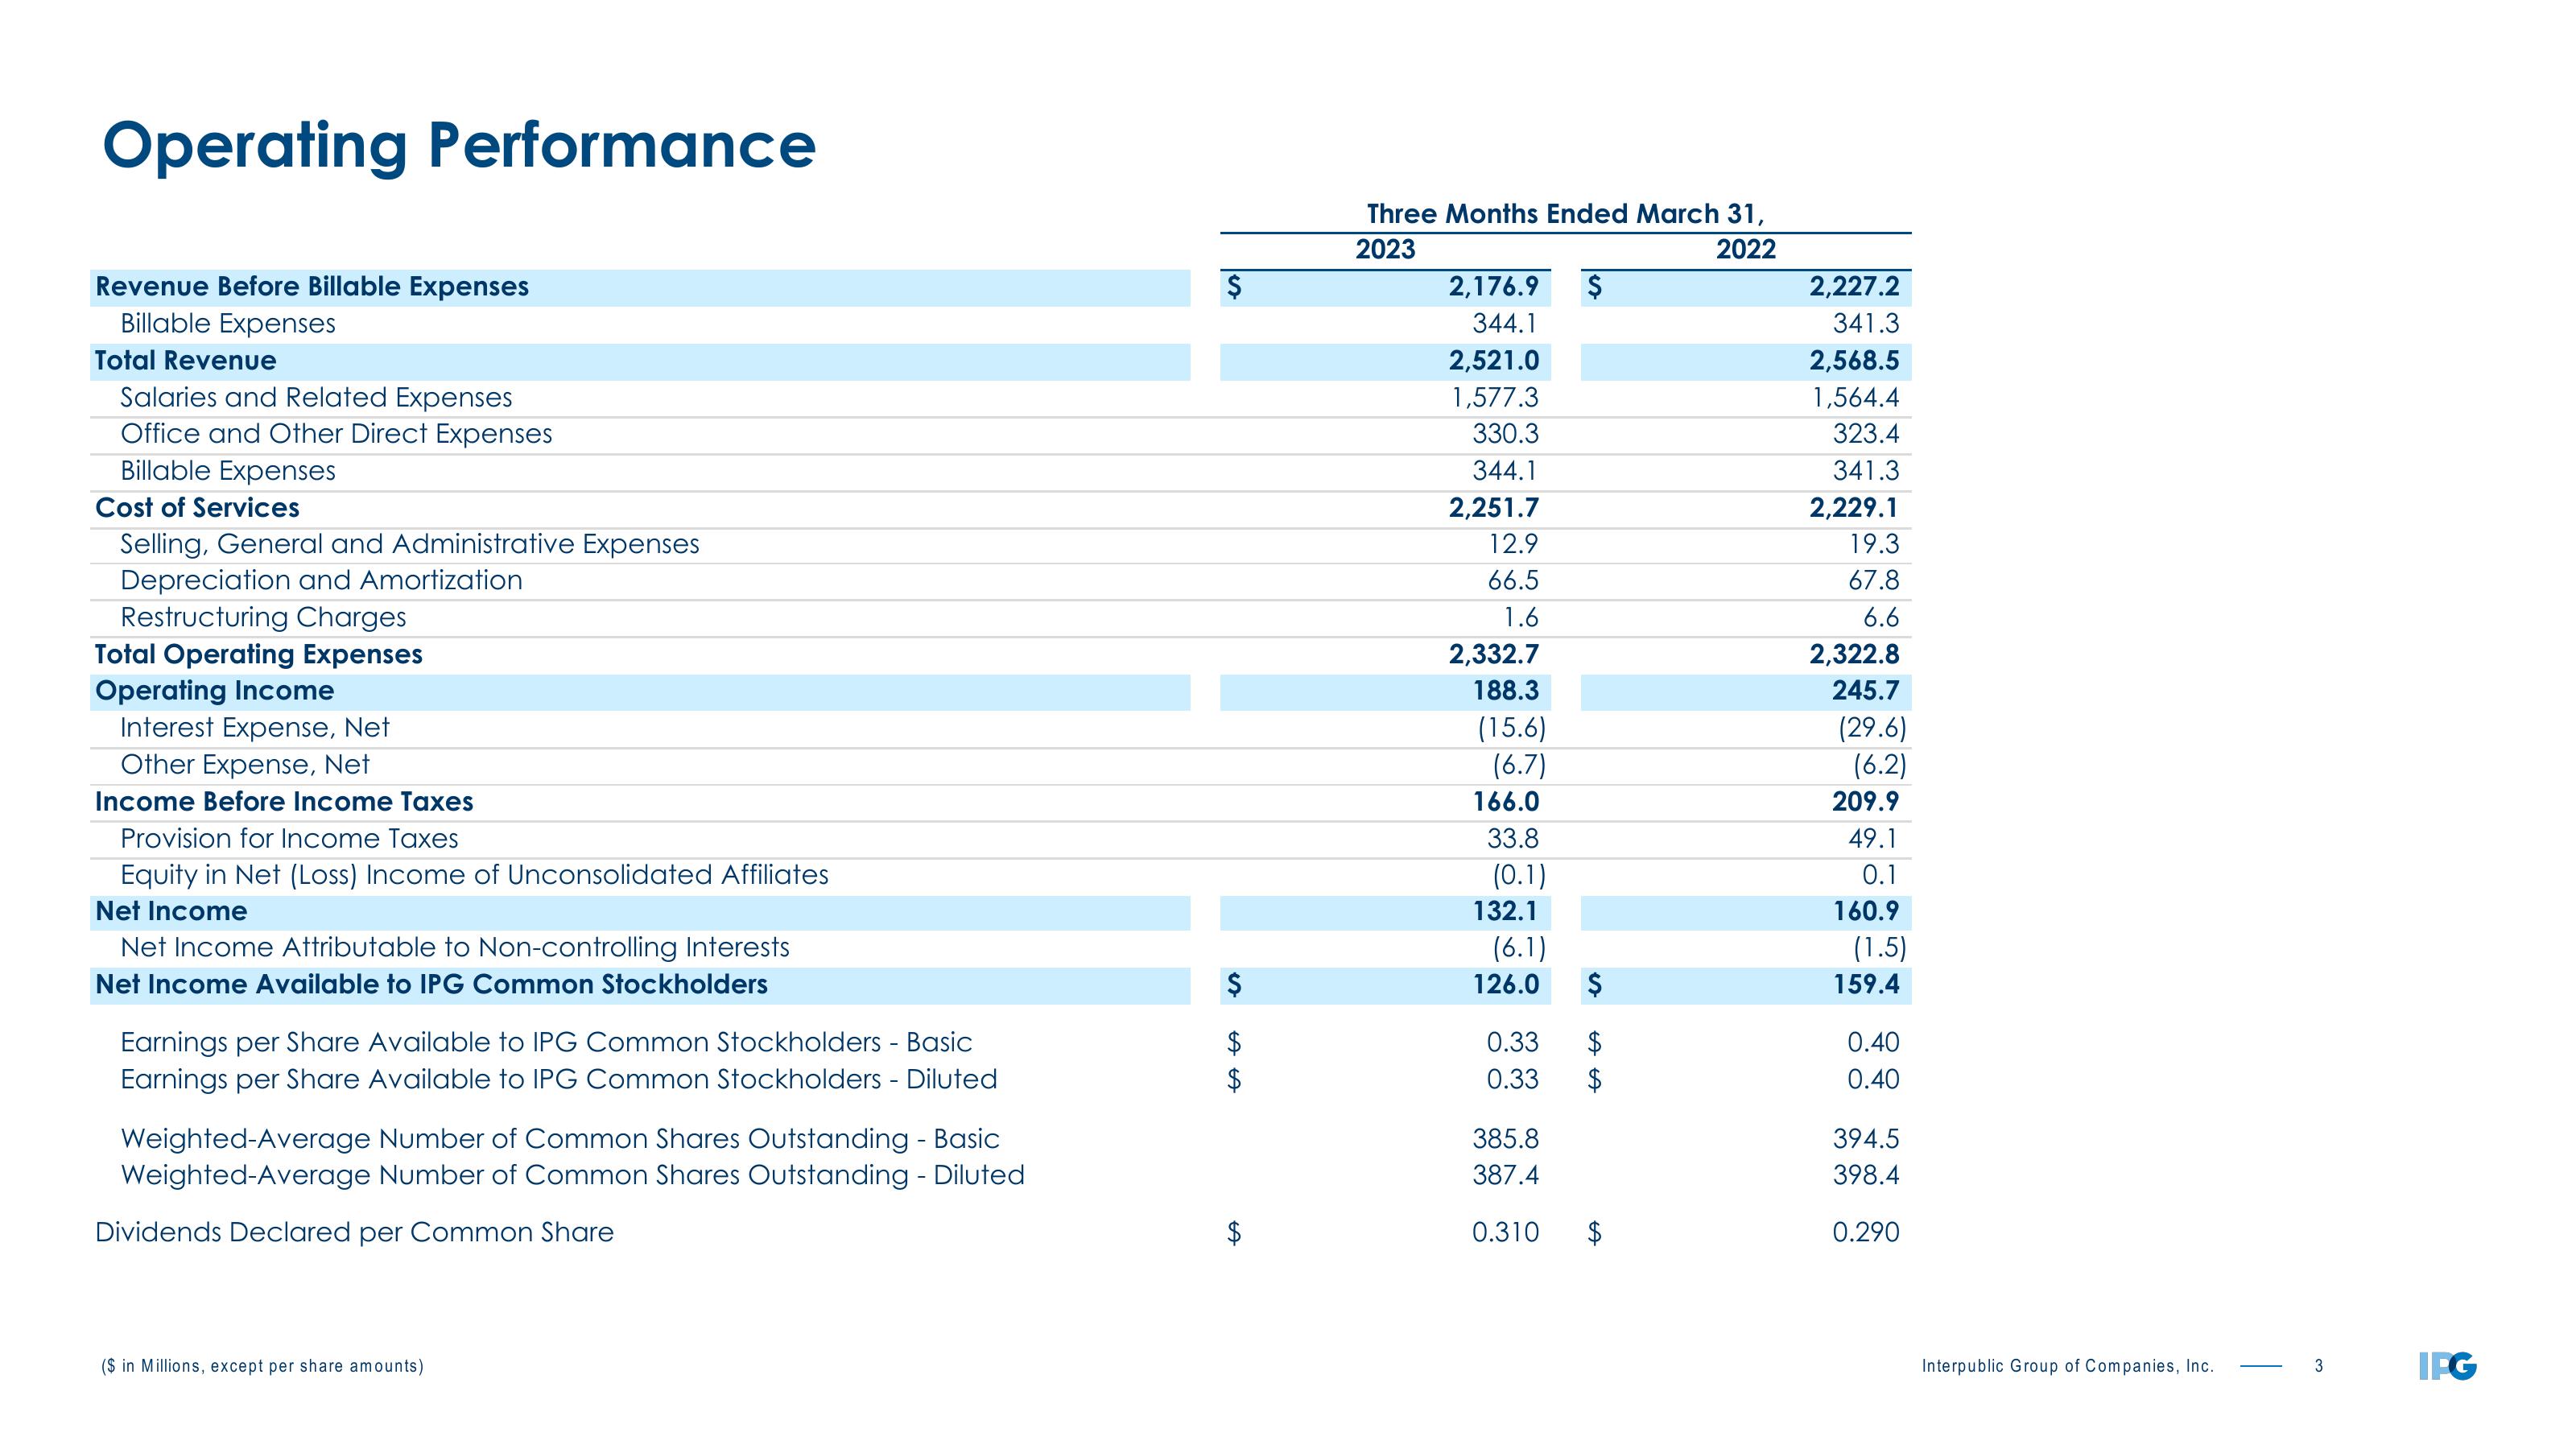
Revenue Before Billable Expenses
Billable Expenses
Total Revenue
Salaries and Related Expenses
Office and Other Direct Expenses
Billable Expenses
Cost of Services
Selling, General and Administrative Expenses
Depreciation and Amortization
Restructuring Charges
Total Operating Expenses
Operating Income
Interest Expense, Net
Other Expense, Net
Income Before Income Taxes
Provision for Income Taxes
Equity in Net (Loss) Income of Unconsolidated Affiliates
Net Income
Net Income Attributable to Non-controlling Interests
Net Income Available to IPG Common Stockholders
Earnings per Share Available to IPG Common Stockholders - Basic
Earnings per Share Available to IPG Common Stockholders - Diluted
Weighted-Average Number of Common Shares Outstanding - Basic
Weighted-Average Number of Common Shares Outstanding - Diluted
Dividends Declared per Common Share
($ in Millions, except per share amounts)
$
$
A LA
Three Months Ended March 31,
2023
2022
2,176.9 $
344.1
2,521.0
1,577.3
330.3
344.1
2,251.7
12.9
66.5
1.6
2,332.7
188.3
(15.6)
(6.7)
166.0
33.8
(0.1)
132.1
(6.1)
126.0 $
0.33
0.33
385.8
387.4
0.310
$
A A
2,227.2
341.3
2,568.5
1,564.4
323.4
341.3
2,229.1
19.3
67.8
6.6
2,322.8
245.7
(29.6)
(6.2)
209.9
49.1
0.1
160.9
(1.5)
159.4
0.40
0.40
394.5
398.4
0.290
Interpublic Group of Companies, Inc.
3
IPGView entire presentation