Zegna Results Presentation Deck
Non-IFRS Financial Measures
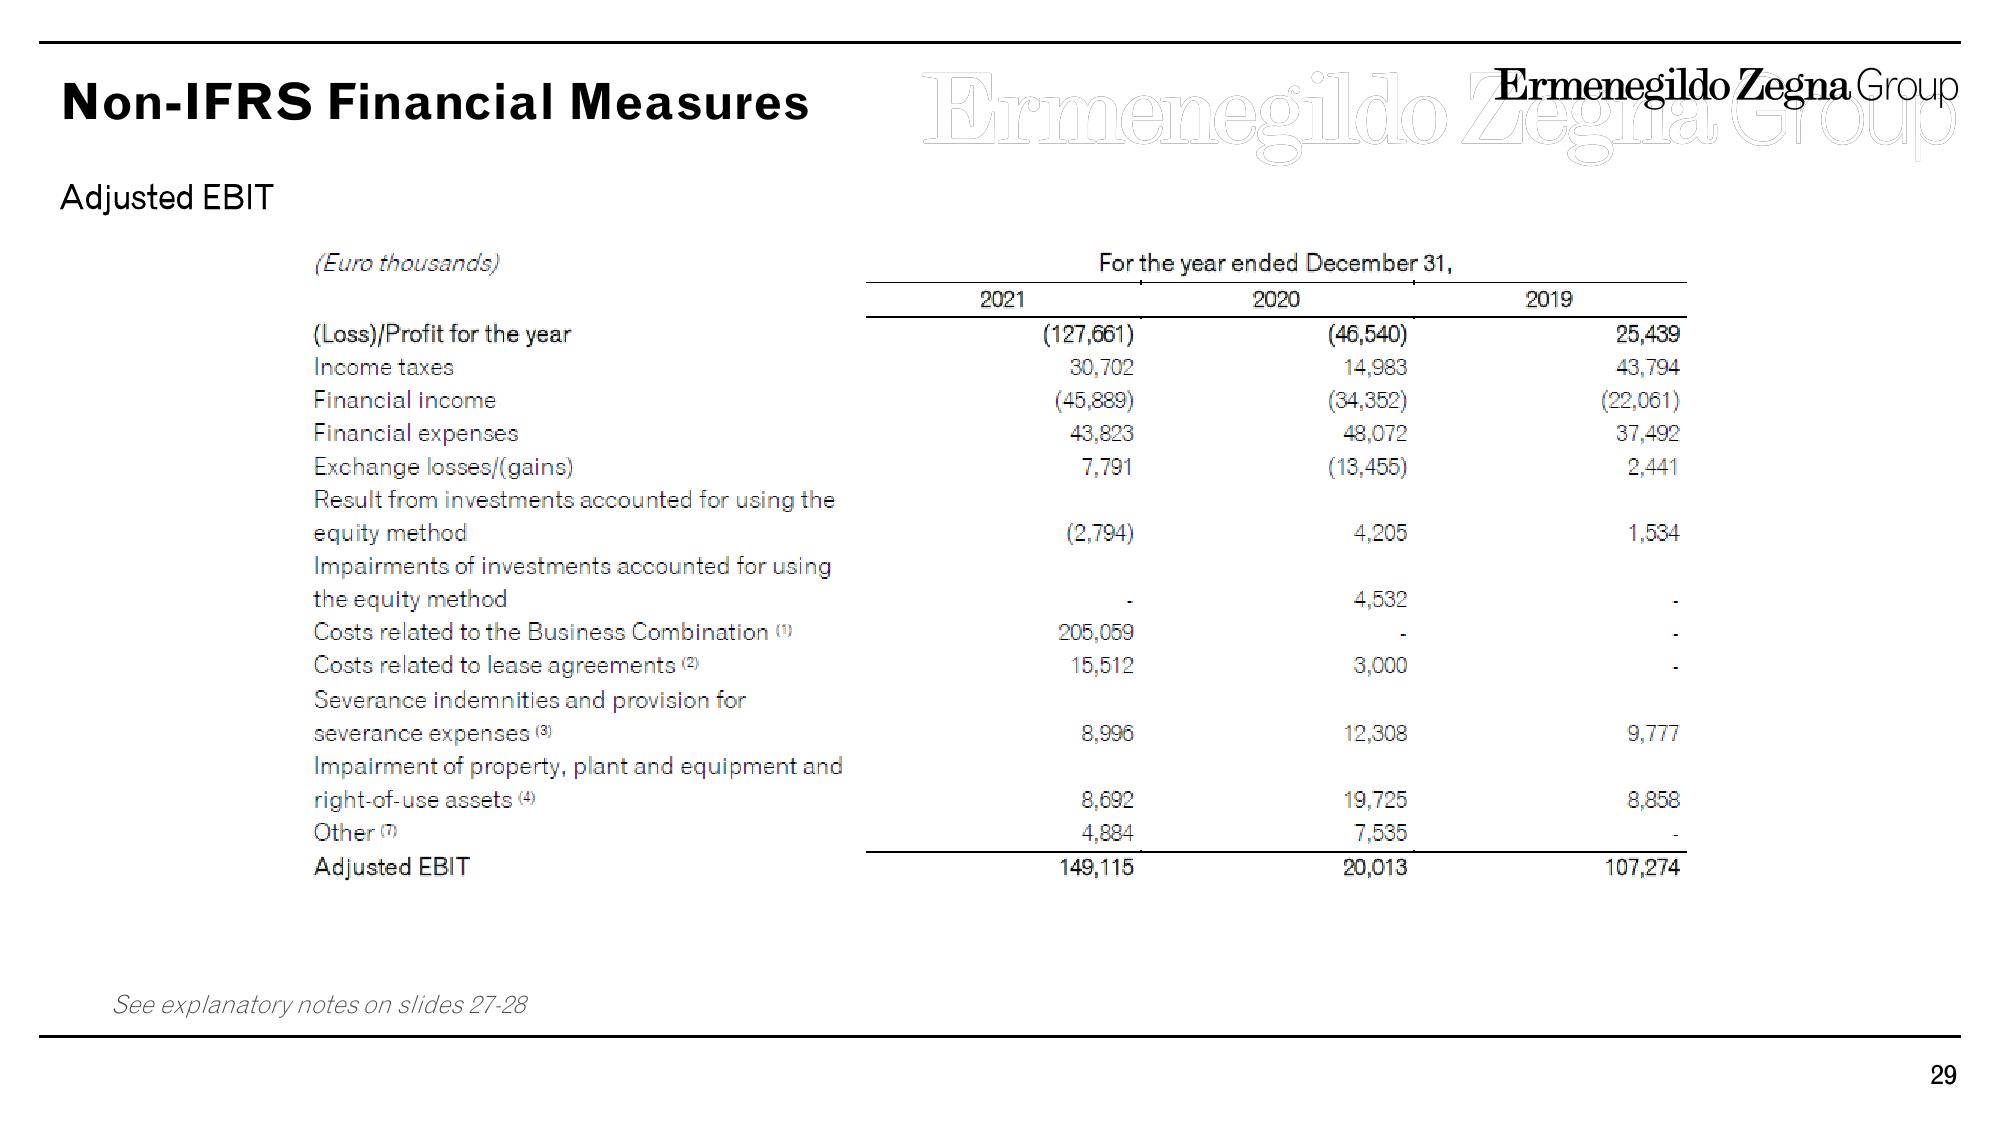
Adjusted EBIT
(Euro thousands)
(Loss)/Profit for the year
Income taxes
Financial income
Financial expenses
Exchange losses/(gains)
Result from investments accounted for using the
equity method
Impairments of investments accounted for using
the equity method
Costs related to the Business Combination (1)
Costs related to lease agreements (2)
Severance indemnities and provision for
severance expenses (3)
Impairment of property, plant and equipment and
right-of-use assets (4)
Other (7)
Adjusted EBIT
See explanatory notes on slides 27-28
Ermenegildo Ermenegildo Zegna Group
2021
For the year ended December 31,
2020
(127,661)
30,702
(45,889)
43,823
7,791
(2,794)
205,059
15,512
8,996
8,692
4,884
149,115
(46,540)
14,983
(34,352)
48,072
(13,455)
4,205
4,532
3,000
12,308
19,725
7,535
20,013
2019
25,439
43,794
(22,061)
37,492
2,441
1,534
9,777
8,858
107,274
29View entire presentation