J.P.Morgan 4Q23 Earnings Results
JPMORGAN CHASE & CO.
CORPORATE
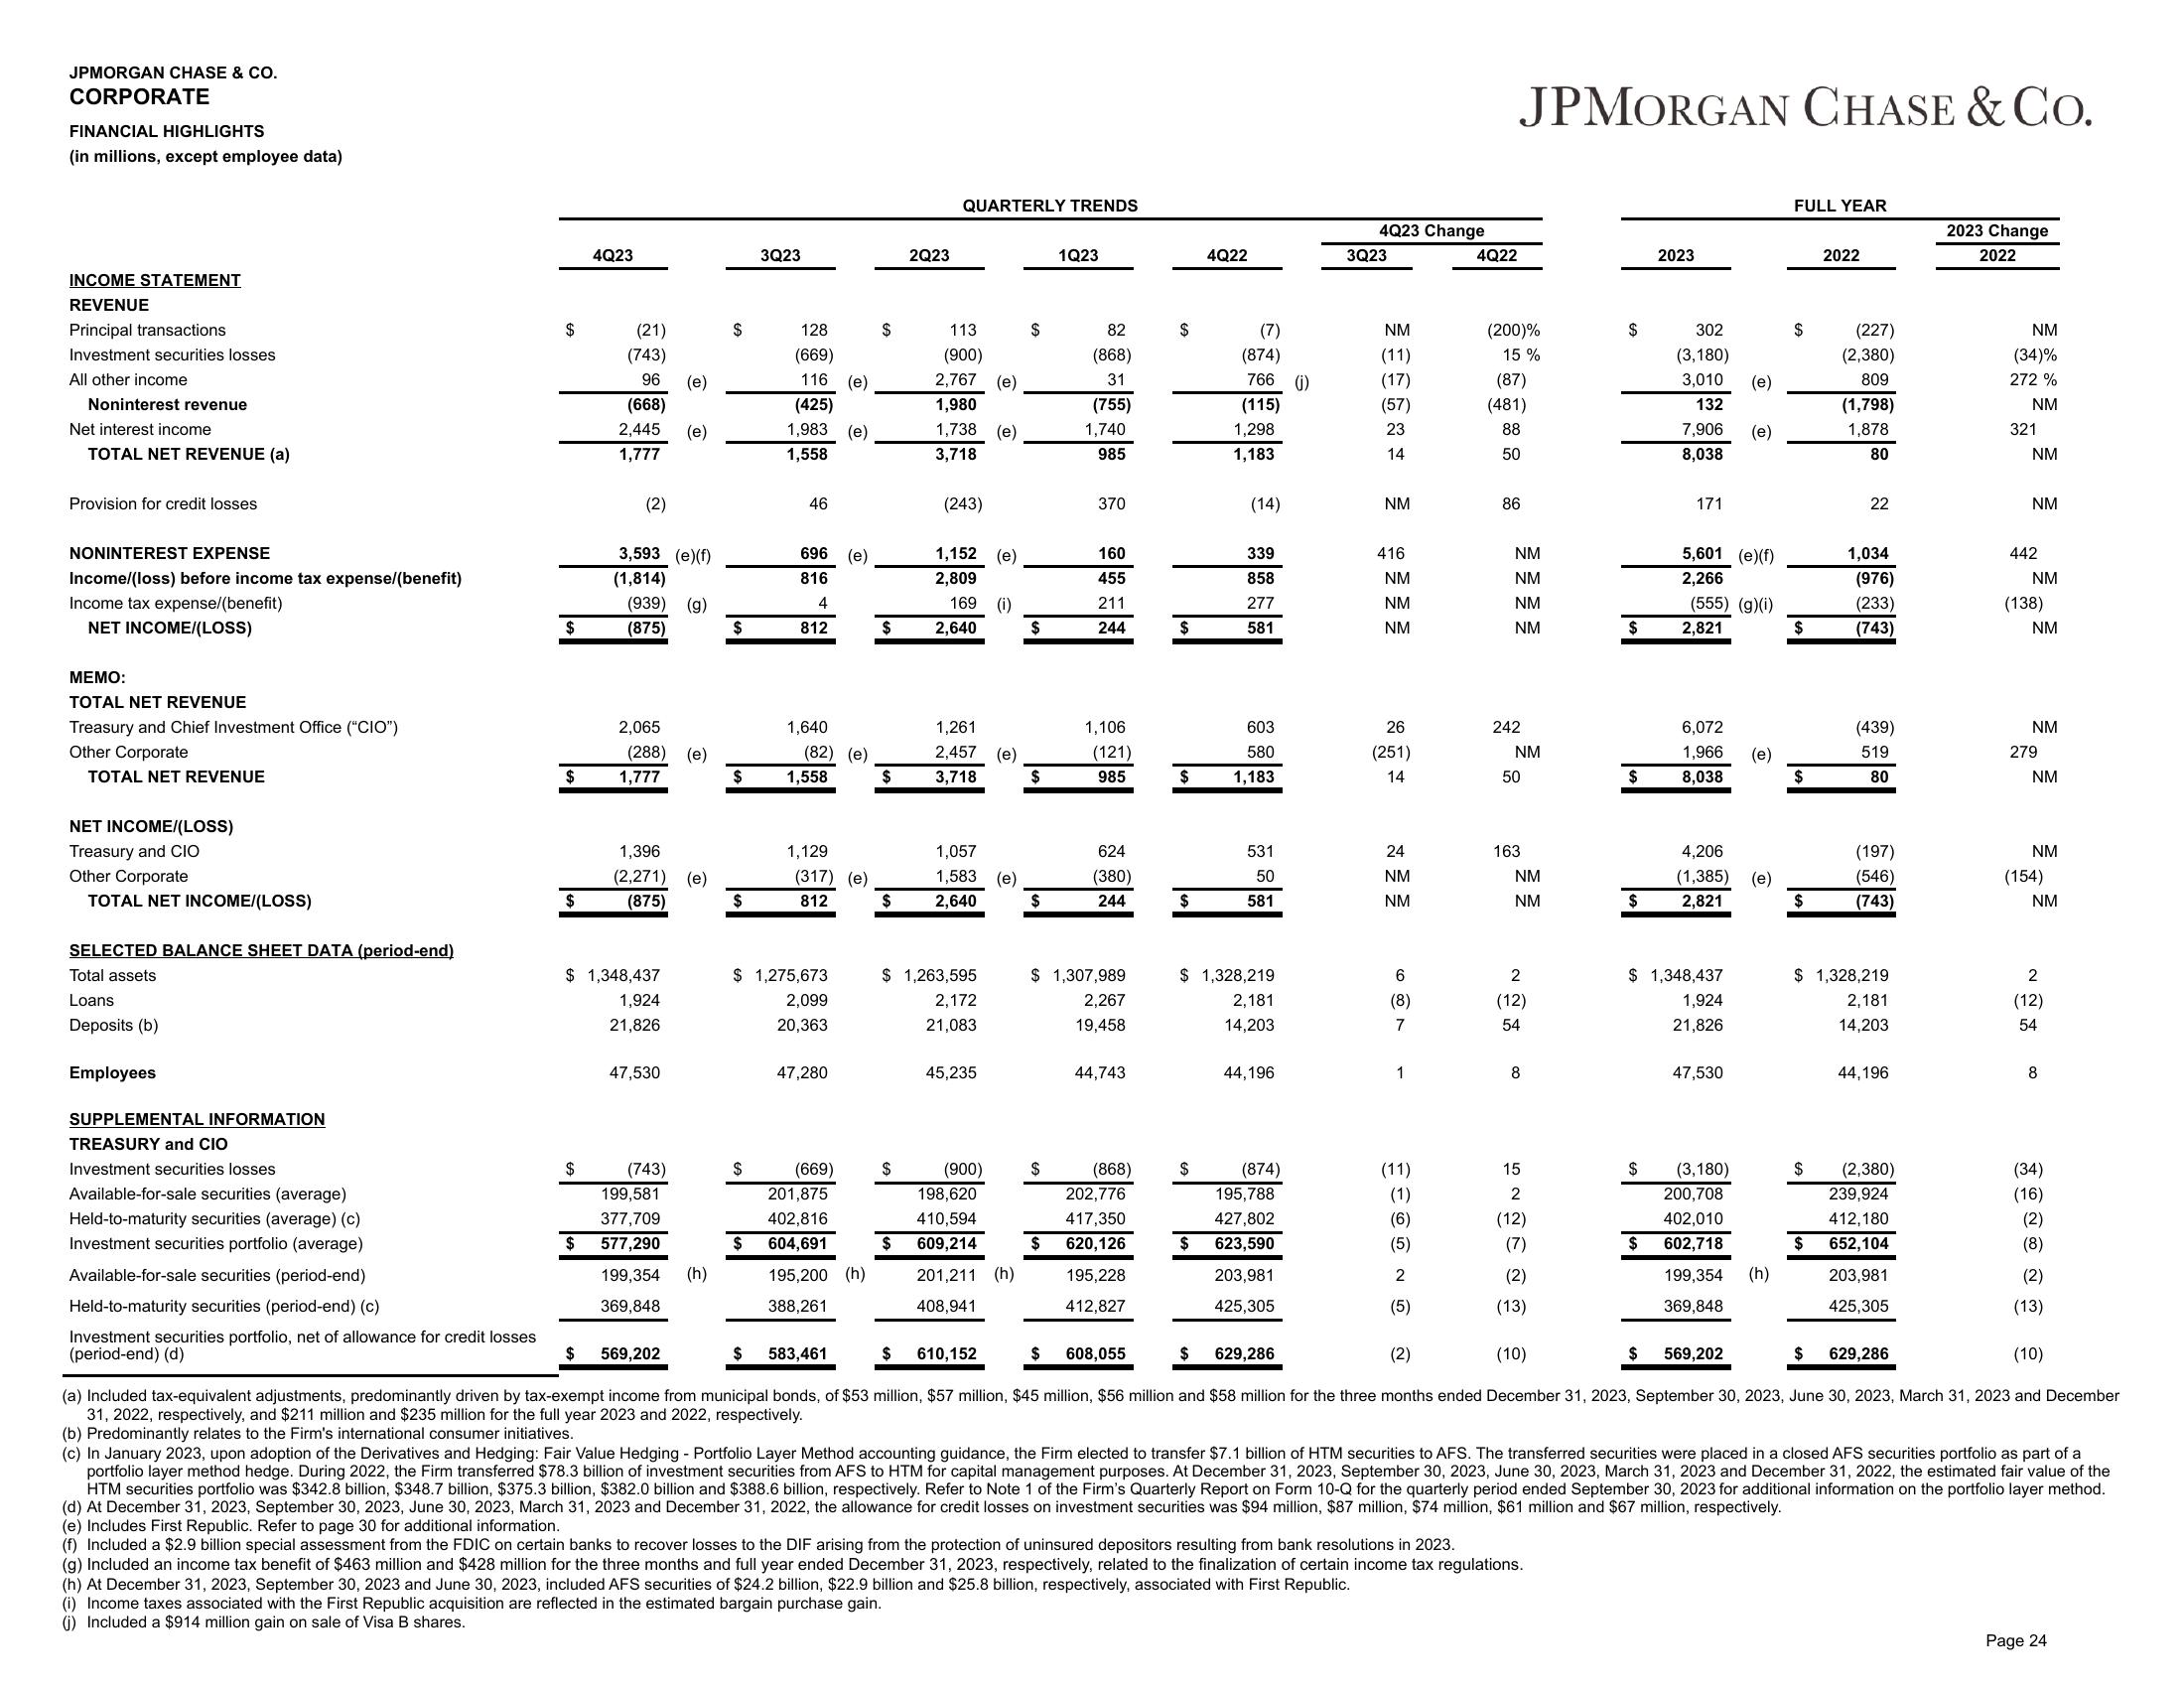
FINANCIAL HIGHLIGHTS
(in millions, except employee data)
INCOME STATEMENT
REVENUE
Principal transactions
Investment securities losses
All other income
Noninterest revenue
Net interest income
TOTAL NET REVENUE (a)
Provision for credit losses
NONINTEREST EXPENSE
Income/(loss) before income tax expense/(benefit)
Income tax expense/(benefit)
NET INCOME/(LOSS)
MEMO:
TOTAL NET REVENUE
Treasury and Chief Investment Office ("CIO")
Other Corporate
TOTAL NET REVENUE
NET INCOME/(LOSS)
Treasury and CIO
Other Corporate
TOTAL NET INCOME/(LOSS)
SELECTED BALANCE SHEET DATA (period-end)
Total assets
Loans
Deposits (b)
Employees
SUPPLEMENTAL INFORMATION
TREASURY and CIO
Investment securities losses
Available-for-sale securities (average)
Held-to-maturity securities (average) (c)
Investment securities portfolio (average)
Available-for-sale securities (period-end)
Held-to-maturity securities (period-end) (c)
Investment securities portfolio, net of allowance for credit losses
(period-end) (d)
$
$
$
$
$
$
4Q23
$
(21)
(743)
96 (e)
(668)
2,445 (e)
1,777
(2)
3,593 (e)(f)
(1,814)
(939) (g)
(875)
$ 1,348,437
1,924
21,826
2,065
(288) (e)
1,777
1,396
(2,271) (e)
(875)
47,530
(743)
199,581
377,709
577,290
199,354
369,848
(h)
$
$
$
$
$
3Q23
$
128
(669)
116
(425)
1,983
1,558
46
696
816
4
812
$ 1,275,673
2,099
20,363
(e)
(e)
1,640
(82) (e)
1,558
47,280
(e)
1,129
(317) (e)
812
(669)
201,875
402,816
604,691
195,200 (h)
388,261
$
$
$
$
$
2Q23
$
QUARTERLY TRENDS
113
(900)
2,767 (e)
1,980
1,738
3,718
(243)
1,152
2,809
169 (i)
2,640
1,261
2,457
3,718
$ 1,263,595
2,172
21,083
(e)
45,235
(e)
1,057
1,583 (e)
2,640
(e)
(900)
198,620
410,594
609,214
201,211 (h)
408,941
$
$
$
$
$
$
1Q23
$
82
(868)
31
(755)
1,740
985
370
160
455
211
244
1,106
$ 1,307,989
2,267
19,458
(121)
985
624
(380)
244
44,743
(868)
202,776
417,350
620,126
195,228
412,827
$
$
$
$
$
4Q22
$
(7)
(874)
766 (j)
(115)
1,298
1,183
(14)
339
858
277
581
603
580
1,183
$ 1,328,219
2,181
14,203
531
50
581
44,196
(874)
195,788
427,802
623,590
203,981
425,305
629,286
4Q23 Change
3Q23
NM
(11)
(17)
(57)
23
14
(h) At December 31, 2023, September 30, 2023 and June 30, 2023, included AFS securities of $24.2 billion, $22.9 billion and $25.8 billion, respectively, associated with First Republic.
(i) Income taxes associated with the First Republic acquisition are reflected in the estimated bargain purchase gain.
(i) Included a $914 million gain on sale of Visa B shares.
NM
416
NM
NM
NM
26
(251)
14
24
NM
NM
6
(8)
7
1
(11)
(6)
(5)
2
(5)
4Q22
JPMORGAN CHASE & CO.
(200)%
15%
(87)
(481)
88
50
86
NM
NM
NM
NM
242
NM
50
163
NM
NM
2
(12)
54
8
15
2
(12)
(7)
(2)
(13)
(f) Included a $2.9 billion special assessment from the FDIC on certain banks to recover losses to the DIF arising from the protection of uninsured depositors resulting from bank resolutions in 2023.
(g) Included an income tax benefit of $463 million and $428 million for the three months and full year ended December 31, 2023, respectively, related to the finalization of certain income tax regulations.
$
$
$
2023
$
302
(3,180)
3,010 (e)
132
7,906
8,038
171
5,601 (e)(f)
2,266
(555) (g)(i)
2,821
6,072
1,966
8,038
$ 1,348,437
1,924
21,826
(e)
4,206
(1,385) (e)
2,821
47,530
(3,180)
200,708
402,010
$ 602,718
199,354
369,848
569,202
(e)
(h)
FULL YEAR
$
$
$
$
$
$
2022
$
(227)
(2,380)
809
(1,798)
1,878
80
22
1,034
(976)
(233)
(743)
$ 1,328,219
2,181
14,203
(439)
519
80
(197)
(546)
(743)
44,196
(2,380)
239,924
412,180
652,104
203,981
425,305
629,286
2023 Change
2022
NM
(34)%
272 %
NM
321
NM
NM
442
NM
(138)
NM
NM
279
NM
NM
(154)
NM
2
(12)
54
569,202
$ 583,461
$ 610,152
608,055
(2)
(10)
(10)
(a) Included tax-equivalent adjustments, predominantly driven by tax-exempt income from municipal bonds, of $53 million, $57 million, $45 million, $56 million and $58 million for the three months ended December 31, 2023, September 30, 2023, June 30, 2023, March 31, 2023 and December
31, 2022, respectively, and $211 million and $235 million for the full year 2023 and 2022, respectively.
(b) Predominantly relates to the Firm's international consumer initiatives.
(c) In January 2023, upon adoption of the Derivatives and Hedging: Fair Value Hedging - Portfolio Layer Method accounting guidance, the Firm elected to transfer $7.1 billion of HTM securities to AFS. The transferred securities were placed in a closed AFS securities portfolio as part of a
portfolio layer method hedge. During 2022, the Firm transferred $78.3 billion of investment securities from AFS to HTM for capital management purposes. At December 31, 2023, September 30, 2023, June 30, 2023, March 31, 2023 and December 31, 2022, the estimated fair value of the
HTM securities portfolio was $342.8 billion, $348.7 billion, $375.3 billion, $382.0 billion and $388.6 billion, respectively. Refer to Note 1 of the Firm's Quarterly Report on Form 10-Q for the quarterly period ended September 30, 2023 for additional information on the portfolio layer method.
(d) At December 31, 2023, September 30, 2023, June 30, 2023, March 31, 2023 and December 31, 2022, the allowance for credit losses on investment securities was $94 million, $87 million, $74 million, $61 million and $67 million, respectively.
(e) Includes First Republic. Refer to page 30 for additional information.
8
(34)
(16)
(2)
(8)
(2)
(13)
Page 24View entire presentation