Pathward Financial Results Presentation Deck
INTEREST RATE RISK MANAGEMENT DECEMBER 31, 2023
Earning Asset Pricing Attributes¹
30%
15%
0%
12%
-15%
26%
53%
12-Month Interest Rate Sensitivity
from Base Net Interest Income
9%
Fixed Rate > 1 Year
Fixed Rate < 1 Year
Floating or Variable
Federal Reserve
Bank Deposits
(Floating or Variable)
¹ Fixed rate securities, loans and leases are shown for contractual periods.
Parallel Shock Alternative Parallel Shock Alternative Ramp
-100
+100
+200
+300
-200
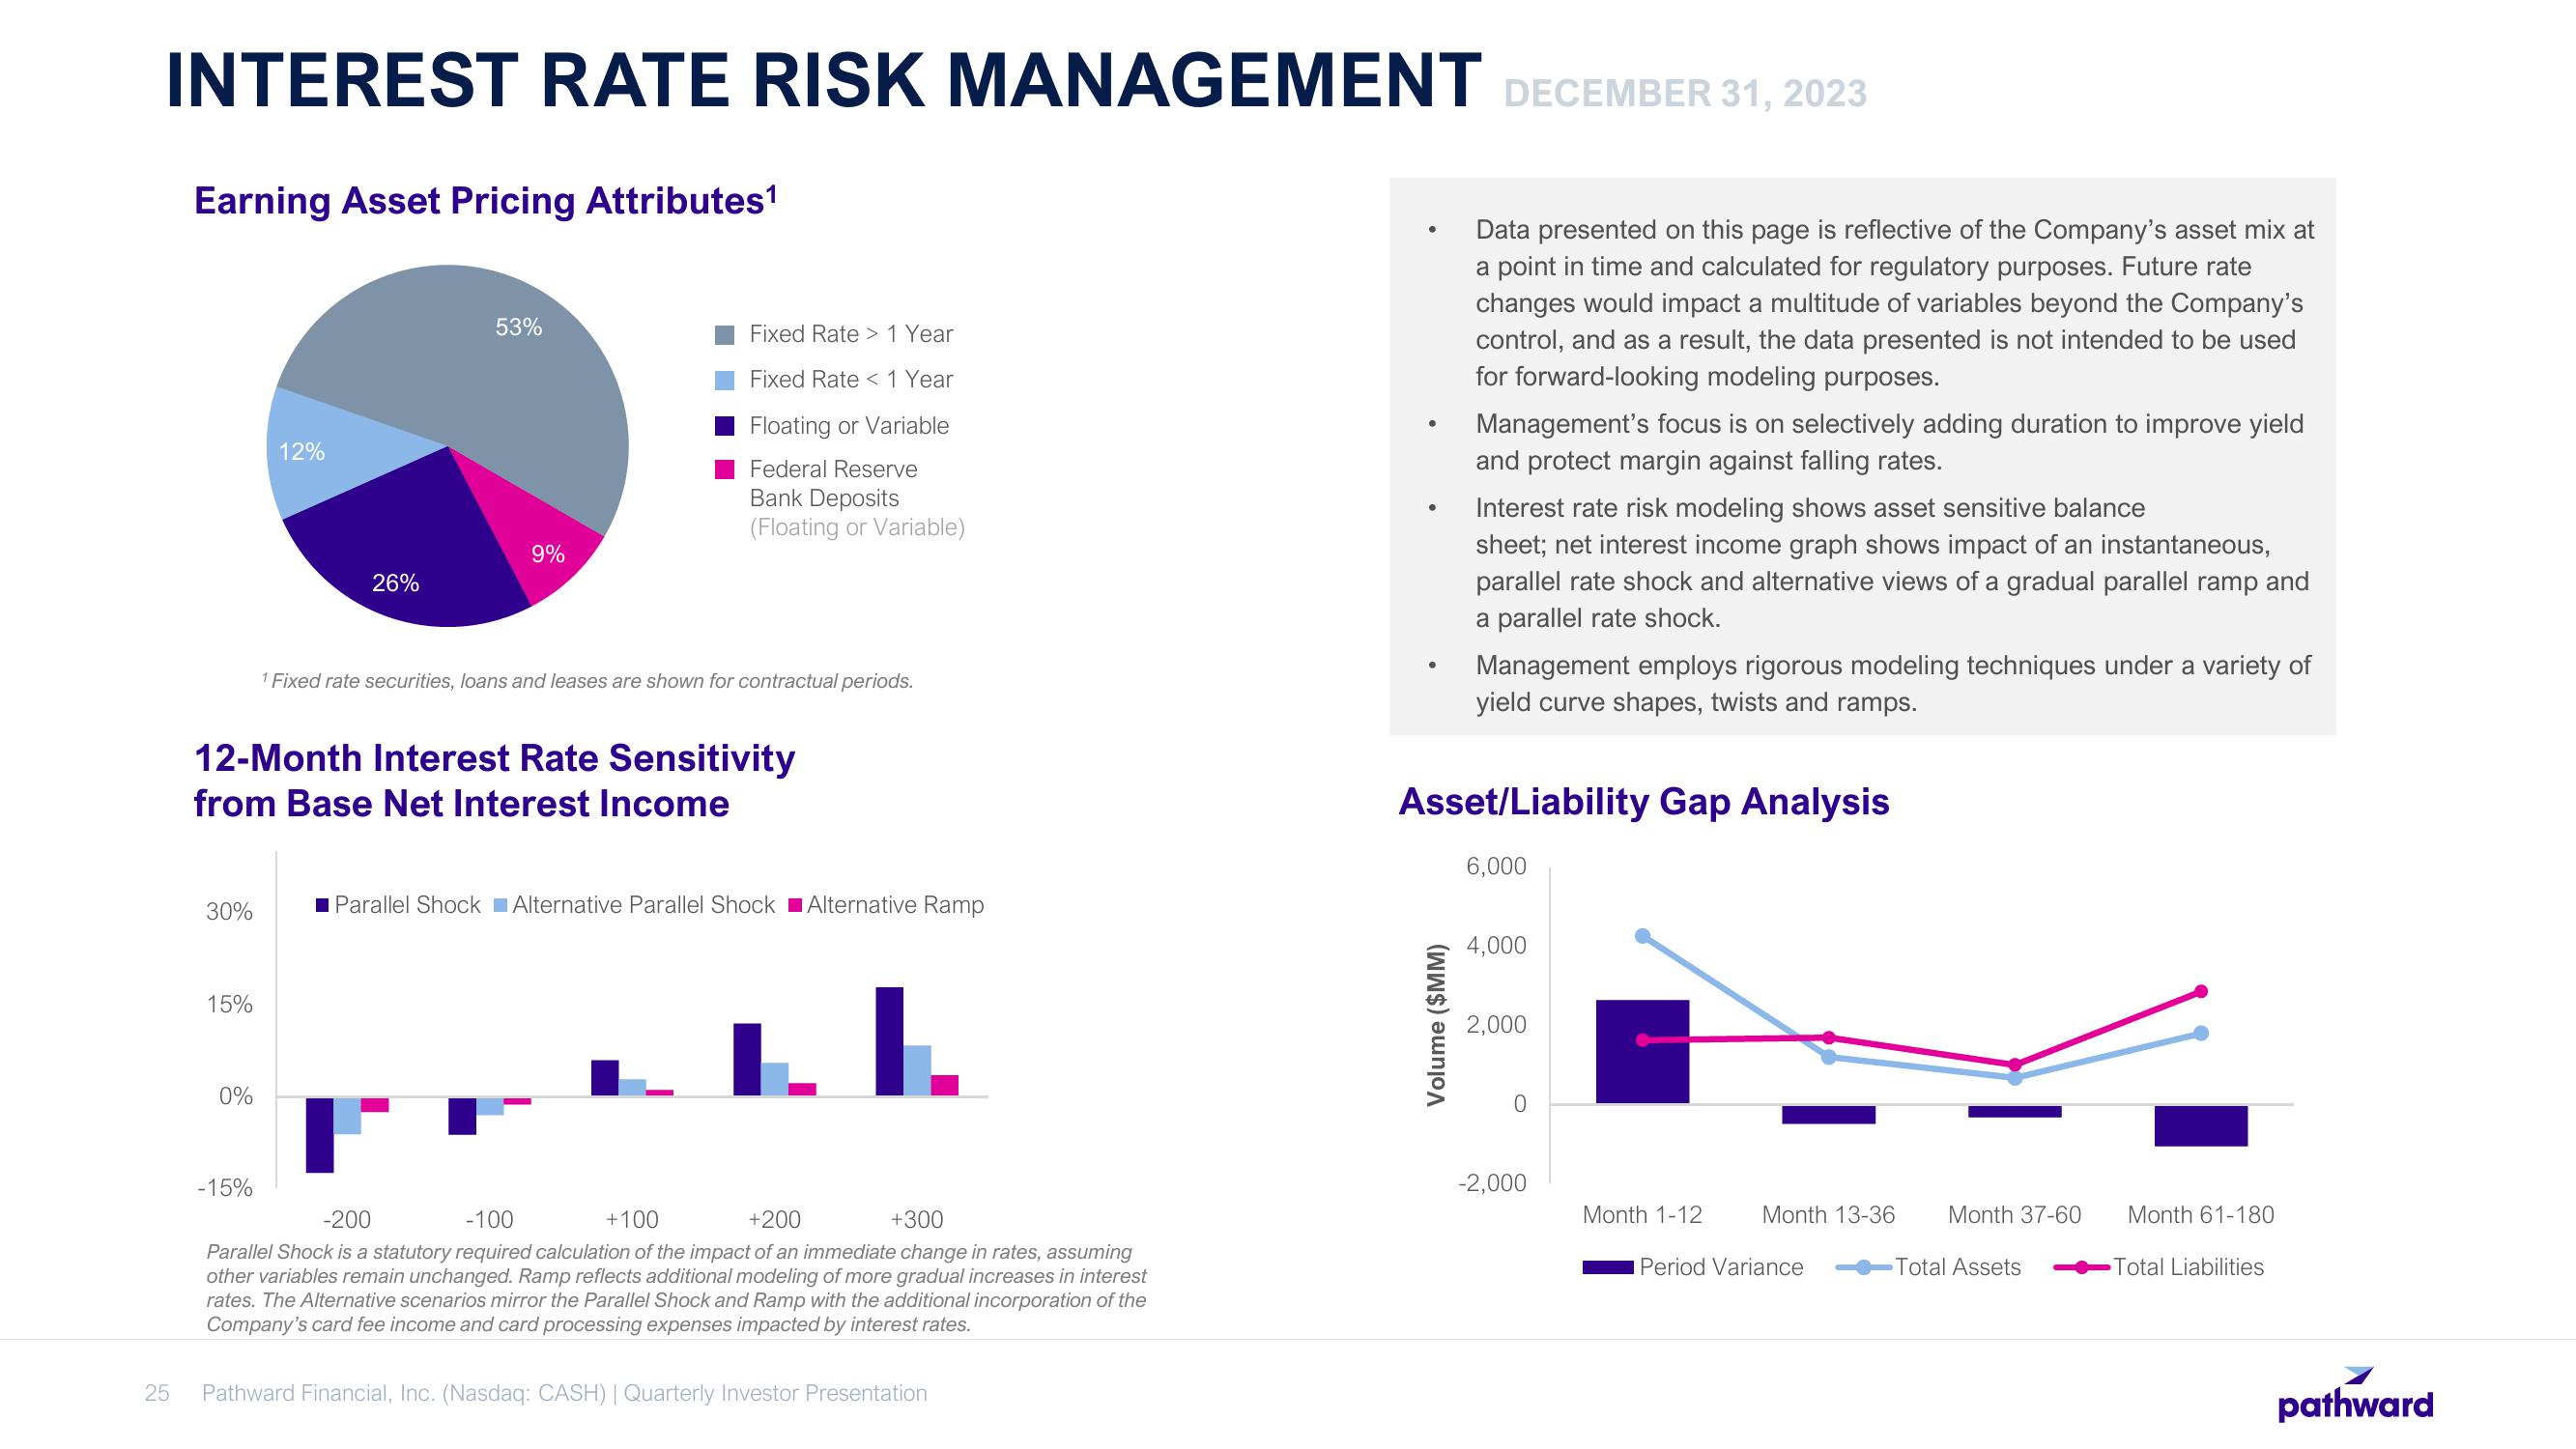
Parallel Shock is a statutory required calculation of the impact of an immediate change in rates, assuming
other variables remain unchanged. Ramp reflects additional modeling of more gradual increases in interest
rates. The Alternative scenarios mirror the Parallel Shock and Ramp with the additional incorporation of the
Company's card fee income and card processing expenses impacted by interest rates.
25 Pathward Financial, Inc. (Nasdaq: CASH) | Quarterly Investor Presentation
●
Data presented on this page is reflective of the Company's asset mix at
a point in time and calculated for regulatory purposes. Future rate
changes would impact a multitude of variables beyond the Company's
control, and as a result, the data presented is not intended to be used
for forward-looking modeling purposes.
Volume ($MM)
Management's focus is on selectively adding duration to improve yield
and protect margin against falling rates.
Interest rate risk modeling shows asset sensitive balance
sheet; net interest income graph shows impact of an instantaneous,
parallel rate shock and alternative views of a gradual parallel ramp and
a parallel rate shock.
Management employs rigorous modeling techniques under a variety of
yield curve shapes, twists and ramps.
Asset/Liability Gap Analysis
6,000
4,000
2,000
-2,000
Month 1-12
Month 13-36
Period Variance
Month 37-60
-Total Assets
Month 61-180
Total Liabilities
pathwardView entire presentation