Vulcan Materials Investor Day Presentation Deck
Appendix -Non-GAAP Reconciliations
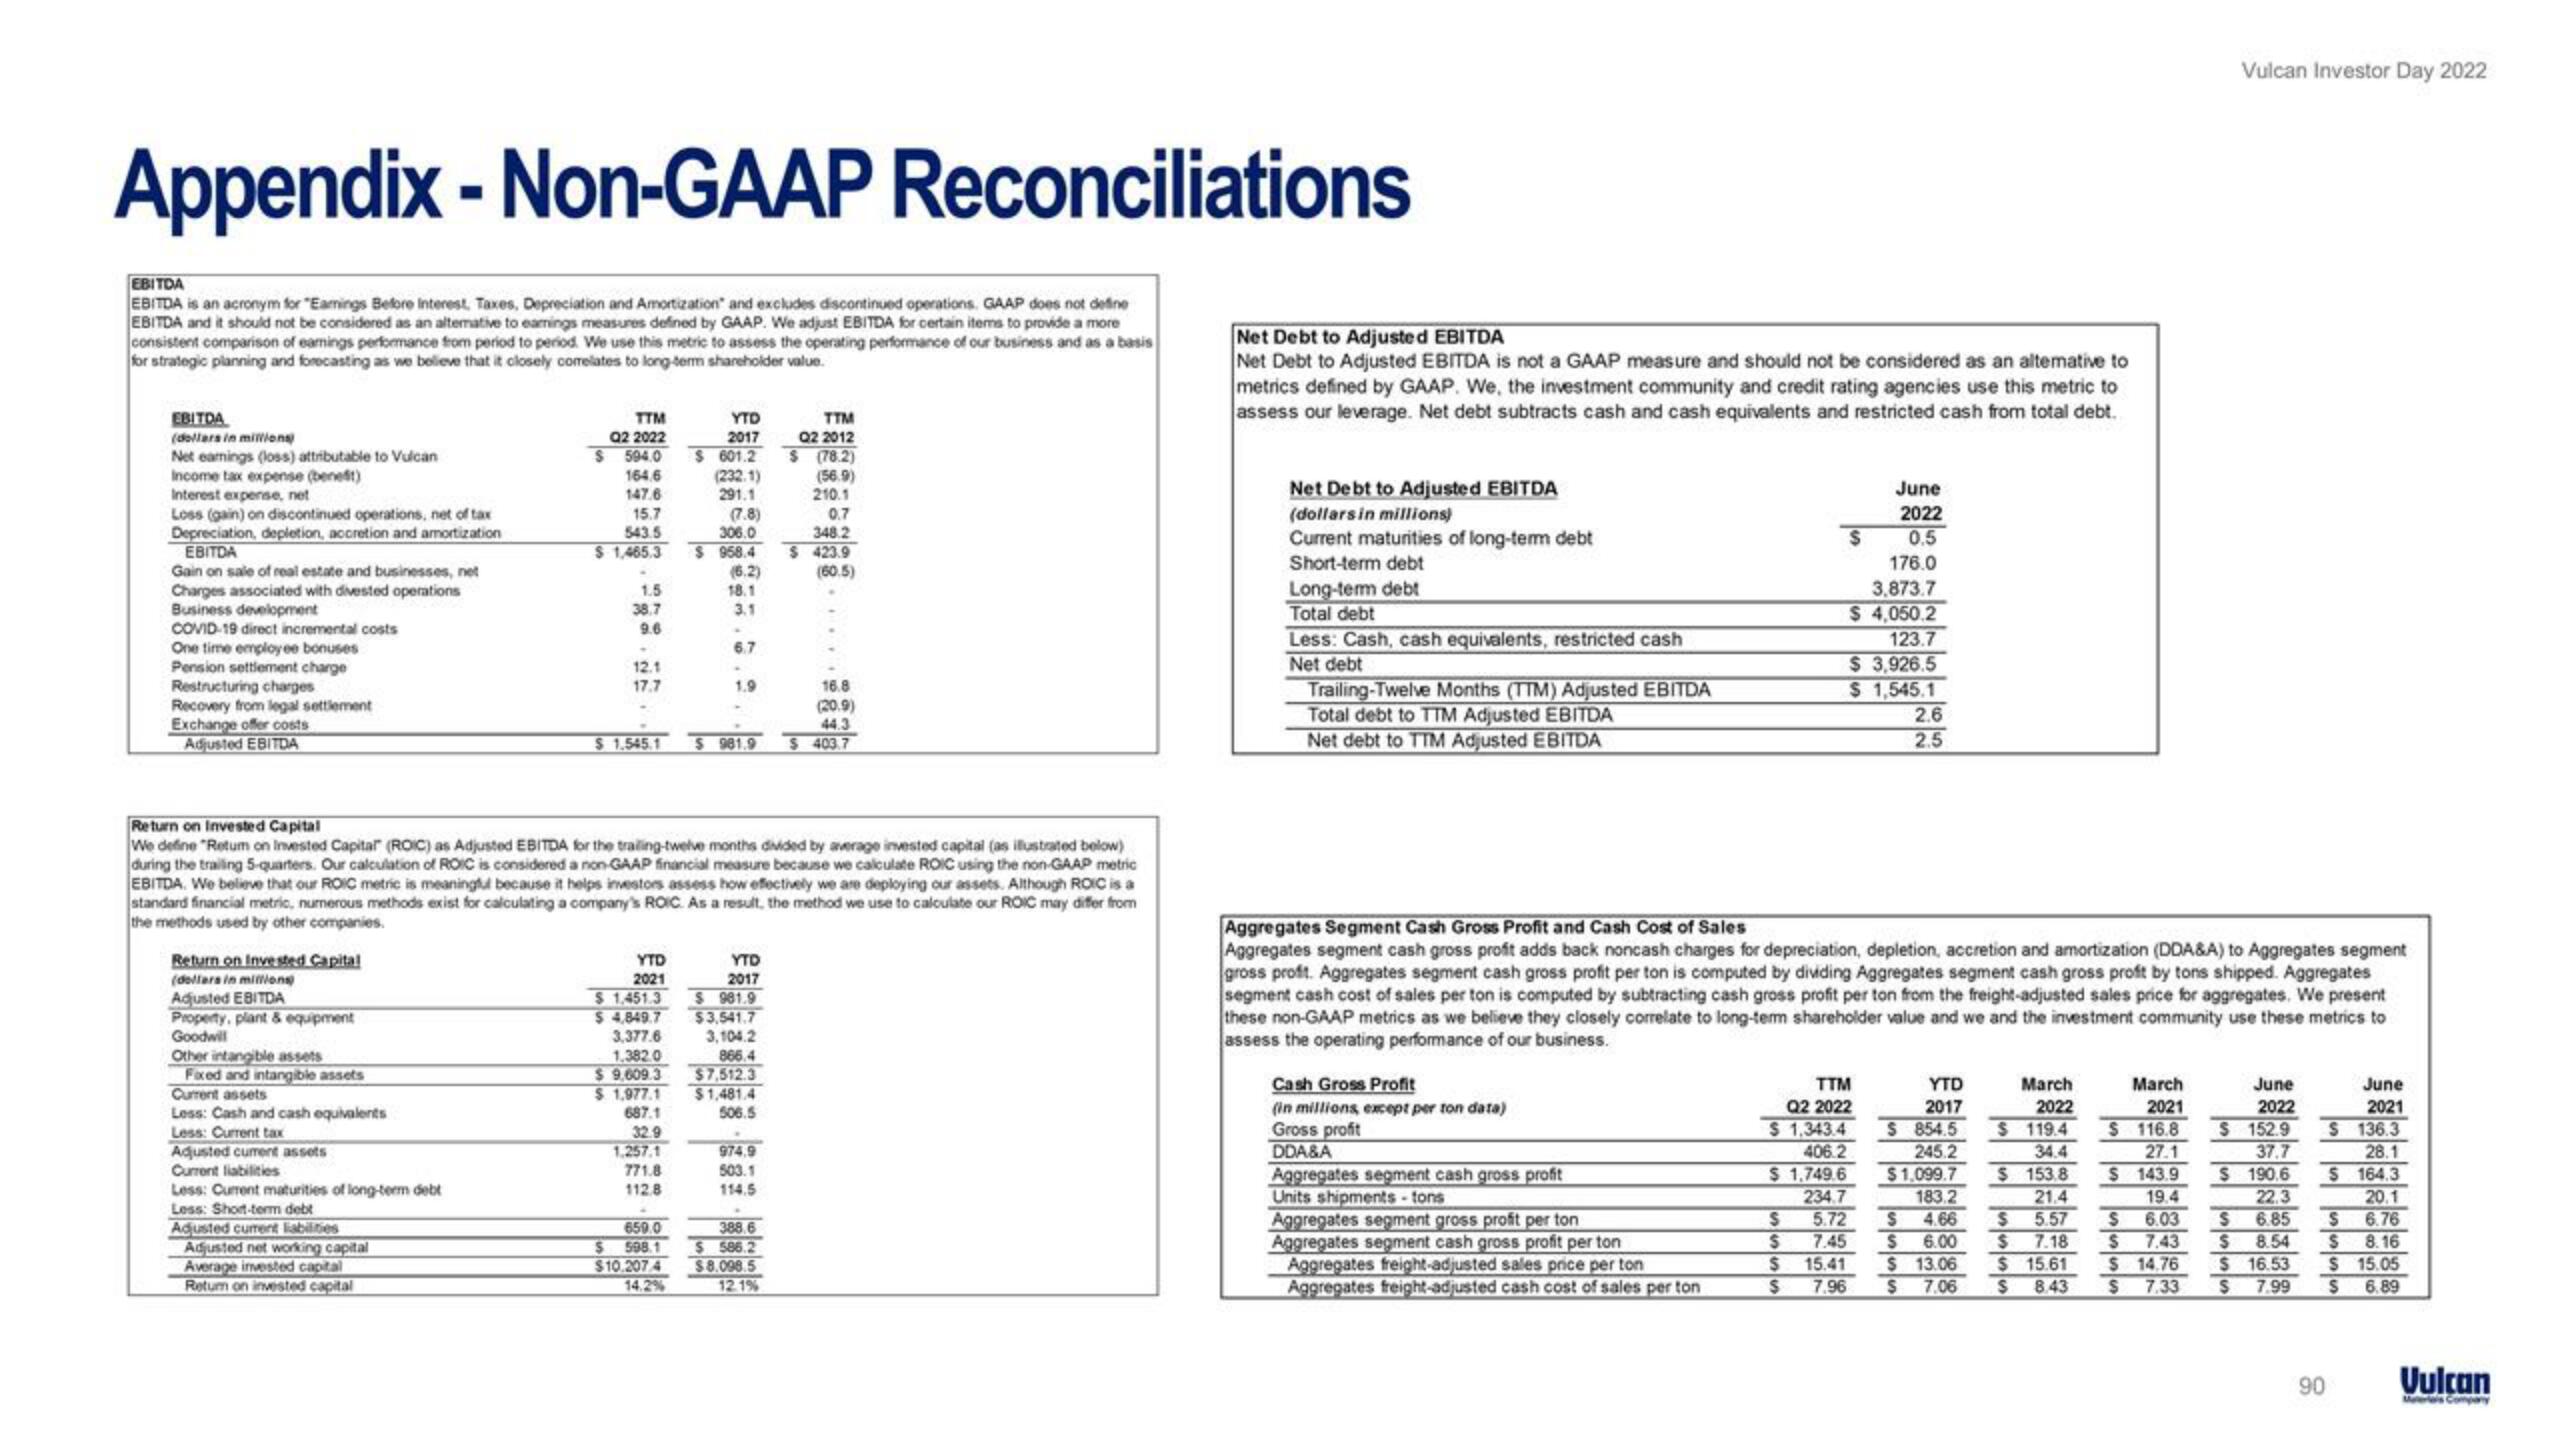
EBITDA
EBITDA is an acronym for "Earnings Before Interest, Taxes, Depreciation and Amortization and excludes discontinued operations. GAAP does not define
EBITDA and it should not be considered as an alternative to earings measures defined by GAAP. We adjust EBITDA for certain items to provide a more
consistent comparison of eamings performance from period to period. We use this metric to assess the operating performance of our business and as a basis
for strategic planning and forecasting as we believe that it closely correlates to long-term shareholder value.
EBITDA
(dollars in millions)
Net eamings (loss) attributable to Vulcan
Income tax expense (benefit)
Interest expense, net
Loss (gain) on discontinued operations, net of tax
Depreciation, depletion, accretion and amortization
EBITDA
Gain on sale of real estate and businesses, net
Charges associated with divested operations
Business development
COVID-19 direct incremental costs
One time employee bonuses
Pension settlement charge
Restructuring charges
Recovery from legal settlement
Exchange offer costs
Adjusted EBITDA
Return on Invested Capital
(dollars in millions)
Adjusted EBITDA
Property, plant & equipment
Goodwill
Other intangible assets
Fixed and intangible assets
Current assets
Less: Cash and cash equivalents
Less: Current tax
Adjusted current assets
Current liabilities
Less: Current maturities of long-term debt
Less: Short-term debt
Adjusted current liabilities
Adjusted net working capital
Average invested capital
non invested capital
TTM
Q2 2022
$ 594.0
164.6
147.6
15.7
543.5
$ 1,465.3 $958.4
1.5
38.7
9.6
12.1
17.7
$1.545.1
YTD
2021
$1.451.3
$4,849.7
3,377.6
1.382.0
$9,609.3
$ 1,977.1
687.1
Return on Invested Capital
We define "Retum on Invested Capital (ROIC) as Adjusted EBITDA for the trailing-twelve months divided by average invested capital (as illustrated below)
during the trailing 5-quarters. Our calculation of ROIC is considered a non-GAAP financial measure because we calculate ROIC using the non-GAAP metric
EBITDA. We believe that our ROIC metric is meaningful because it helps investors assess how effectively we are deploying our assets. Although ROIC is a
standard financial metric, numerous methods exist for calculating a company's ROIC. As a result, the method we use to calculate our ROIC may differ from
the methods used by other companies.
32.9
YTD
2017
1,257.1
771.8
112.8
659.0
$ 598.1
$10.2074
14.2%
$601.2
(232.1)
291.1
(7.8)
306.0
(6.2)
18.1
3.1
6.7
1.9
$981.9
YTD
2017
$981.9
$3,541.7
3,104.2
866.4
$7,512.3
$1,481.4
506.5
974.9
503.1
114.5
TTM
Q2 2012
388.6
$ 586.2
$8.098.5
12.1%
S (78.2)
(56.9)
210.1
0.7
348.2
$423.9
(60.5)
16.8
(20.9)
44.3
$403.7
Net Debt to Adjusted EBITDA
Net Debt to Adjusted EBITDA is not a GAAP measure and should not be considered as an alterative to
metrics defined by GAAP. We, the investment community and credit rating agencies use this metric to
assess our leverage. Net debt subtracts cash and cash equivalents and restricted cash from total debt.
Net Debt to Adjusted EBITDA
(dollars in millions)
Current maturities of long-term debt
Short-term debt
Long-term debt
Total debt
Less: Cash, cash equivalents, restricted cash
Net debt
Trailing-Twelve Months (TTM) Adjusted EBITDA
Total debt to TTM Adjusted EBITDA
Net debt to TTM Adjusted EBITDA
Cash Gross Profit
(in millions, except per ton data)
Gross profit
DDA&A
Aggregates segment cash gross profit
Units shipments-tons
June
2022
0.5
176.0
3,873.7
$ 4,050.2
123.7
$ 3,926.5
$ 1,545.1
Aggregates segment gross profit per ton
Aggregates segment cash gross profit per ton
Aggregates freight-adjusted sales price per ton
Aggregates freight-adjusted cash cost of sales per ton
$
Aggregates Segment Cash Gross Profit and Cash Cost of Sales
Aggregates segment cash gross profit adds back noncash charges for depreciation, depletion, accretion and amortization (DDA&A) to Aggregates segment
gross profit. Aggregates segment cash gross profit per ton is computed by dividing Aggregates segment cash gross proft by tons shipped. Aggregates
segment cash cost of sales per ton is computed by subtracting cash gross profit per ton from the freight-adjusted sales price for aggregates. We present
these non-GAAP metrics as we believe they closely correlate to long-term shareholder value and we and the investment community use these metrics to
assess the operating performance of our business.
TTM
Q2 2022
2.6
2.5
$ 1,343.4
406.2
$ 1,749.6
234.7
$ 5.72
$
7.45
15.41
$
$
YTD
2017
S 854.5
245.2
$1,099.7
183.2
$ 4.66
$ 6.00
$ 13.06
$ 7.0
March
2022
$ 119.4
34.4
$ 153.8
21.4
$ 5.57
$ 7.18
$15.61
Vulcan Investor Day 2022
March
2021
$116.8
27.1
$143.9
19.4
$ 6.03
$ 7.43
$ 14.76
June
2022
$ 152.9
37.7
$190.6
22.3
$ 6.85
$ 8.54
$16.53
June
2021
S 136.3
28.1
$164.3
20.1
$ 6.76
$ 8.16
$15.05
6.89
90
Vulcan
Mas CompanyView entire presentation