J.P.Morgan 2Q23 Investor Results
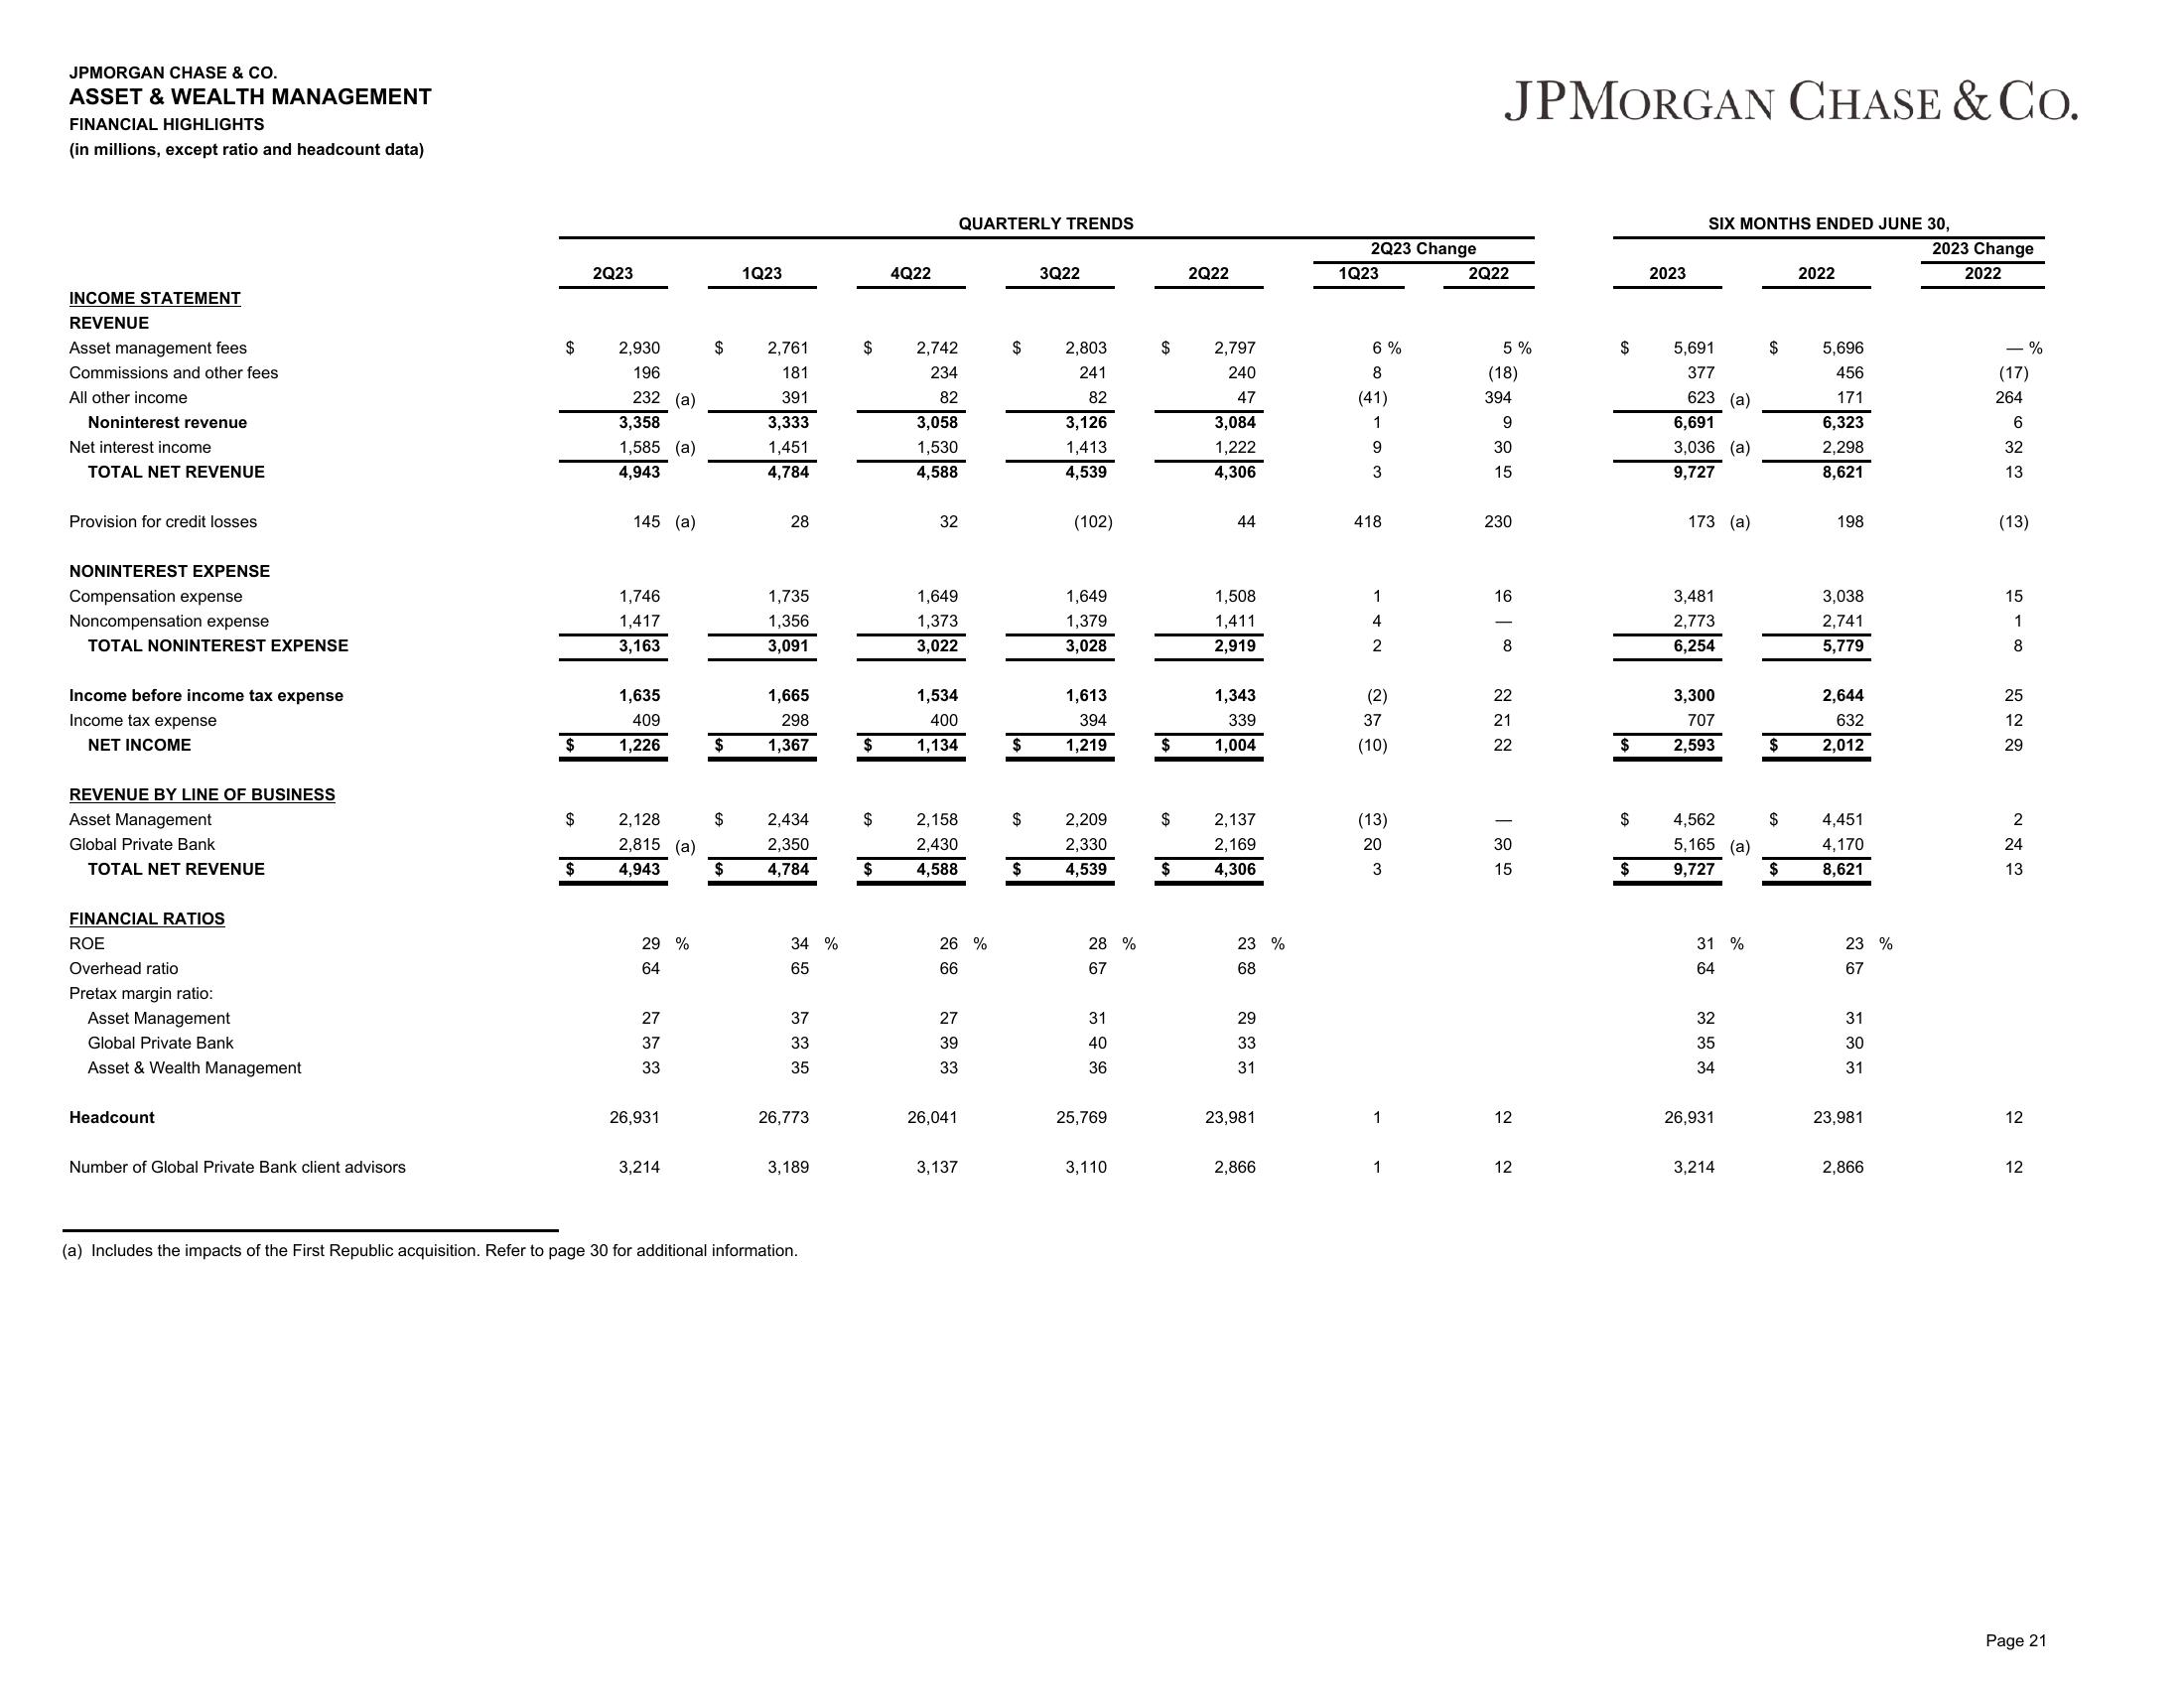
JPMORGAN CHASE & CO.
ASSET & WEALTH MANAGEMENT
FINANCIAL HIGHLIGHTS
(in millions, except ratio and headcount data)
INCOME STATEMENT
REVENUE
Asset management fees
Commissions and other fees
All other income
Noninterest revenue
Net interest income
TOTAL NET REVENUE
Provision for credit losses
NONINTEREST EXPENSE
Compensation expense
Noncompensation expense
TOTAL NONINTEREST EXPENSE
Income before income tax expense
Income tax expense
NET INCOME
REVENUE BY LINE OF BUSINESS
Asset Management
Global Private Bank
TOTAL NET REVENUE
FINANCIAL RATIOS
ROE
Overhead ratio
Pretax margin ratio:
Asset Management
Global Private Bank
Asset & Wealth Management
Headcount
Number of Global Private Bank client advisors
$
$
$
$
2Q23
2,930
196
232 (a)
3,358
1,585 (a)
4,943
145 (a)
1,746
1,417
3,163
1,635
409
1,226
2,128
2,815 (a)
4,943
29 %
64
27
37
33
26,931
3,214
$
$
$
$
1Q23
2,761
181
391
3,333
1,451
4,784
28
1,735
1,356
3,091
1,665
298
1,367
2,434
2,350
4,784
34 %
65
37
33
35
26,773
3,189
(a) Includes the impacts of the First Republic acquisition. Refer to page 30 for additional information.
$
4Q22
2,742
234
82
3,058
1,530
4,588
32
1,649
1,373
3,022
QUARTERLY TRENDS
1,534
400
1,134
$ 2,158
2,430
$ 4,588
26 %
66
27
39
33
26,041
3,137
$
$
$
$
3Q22
2,803
241
82
3,126
1,413
4,539
(102)
1,649
1,379
3,028
1,613
394
1,219
2,209
2,330
4,539
28 %
67
31
40
36
25,769
3,110
$ 2,797
240
47
3,084
1,222
4,306
$
2Q22
$
44
1,508
1,411
2,919
1,343
339
1,004
2,137
2,169
4,306
23 %
68
29
33
31
23,981
2,866
2Q23 Change
1Q23
6%
8
(41)
1
9
3
418
142
(2)
37
(10)
(13)
20
3
1
1
JPMORGAN CHASE & Co.
2Q22
5%
(18)
394
9
30
15
230
16
8
22
21
22
30
15
12
12
$
$
$
$
2023
SIX MONTHS ENDED JUNE 30,
5,691
377
623 (a)
6,691
3,036 (a)
9,727
173 (a)
3,481
2,773
6,254
3,300
707
2,593
4,562
5,165 (a)
9,727
31 %
64
32
35
34
26,931
3,214
$
$
$
2022
5,696
456
171
6,323
2,298
8,621
198
3,038
2,741
5,779
2,644
632
2,012
4,451
4,170
8,621
23 %
67
31
30
31
23,981
2,866
2023 Change
2022
(17)
264
6
32
13
(13)
15
1
8
25
12
29
2
24
13
%
12
12
Page 21View entire presentation