Bridge Investment Group Results Presentation Deck
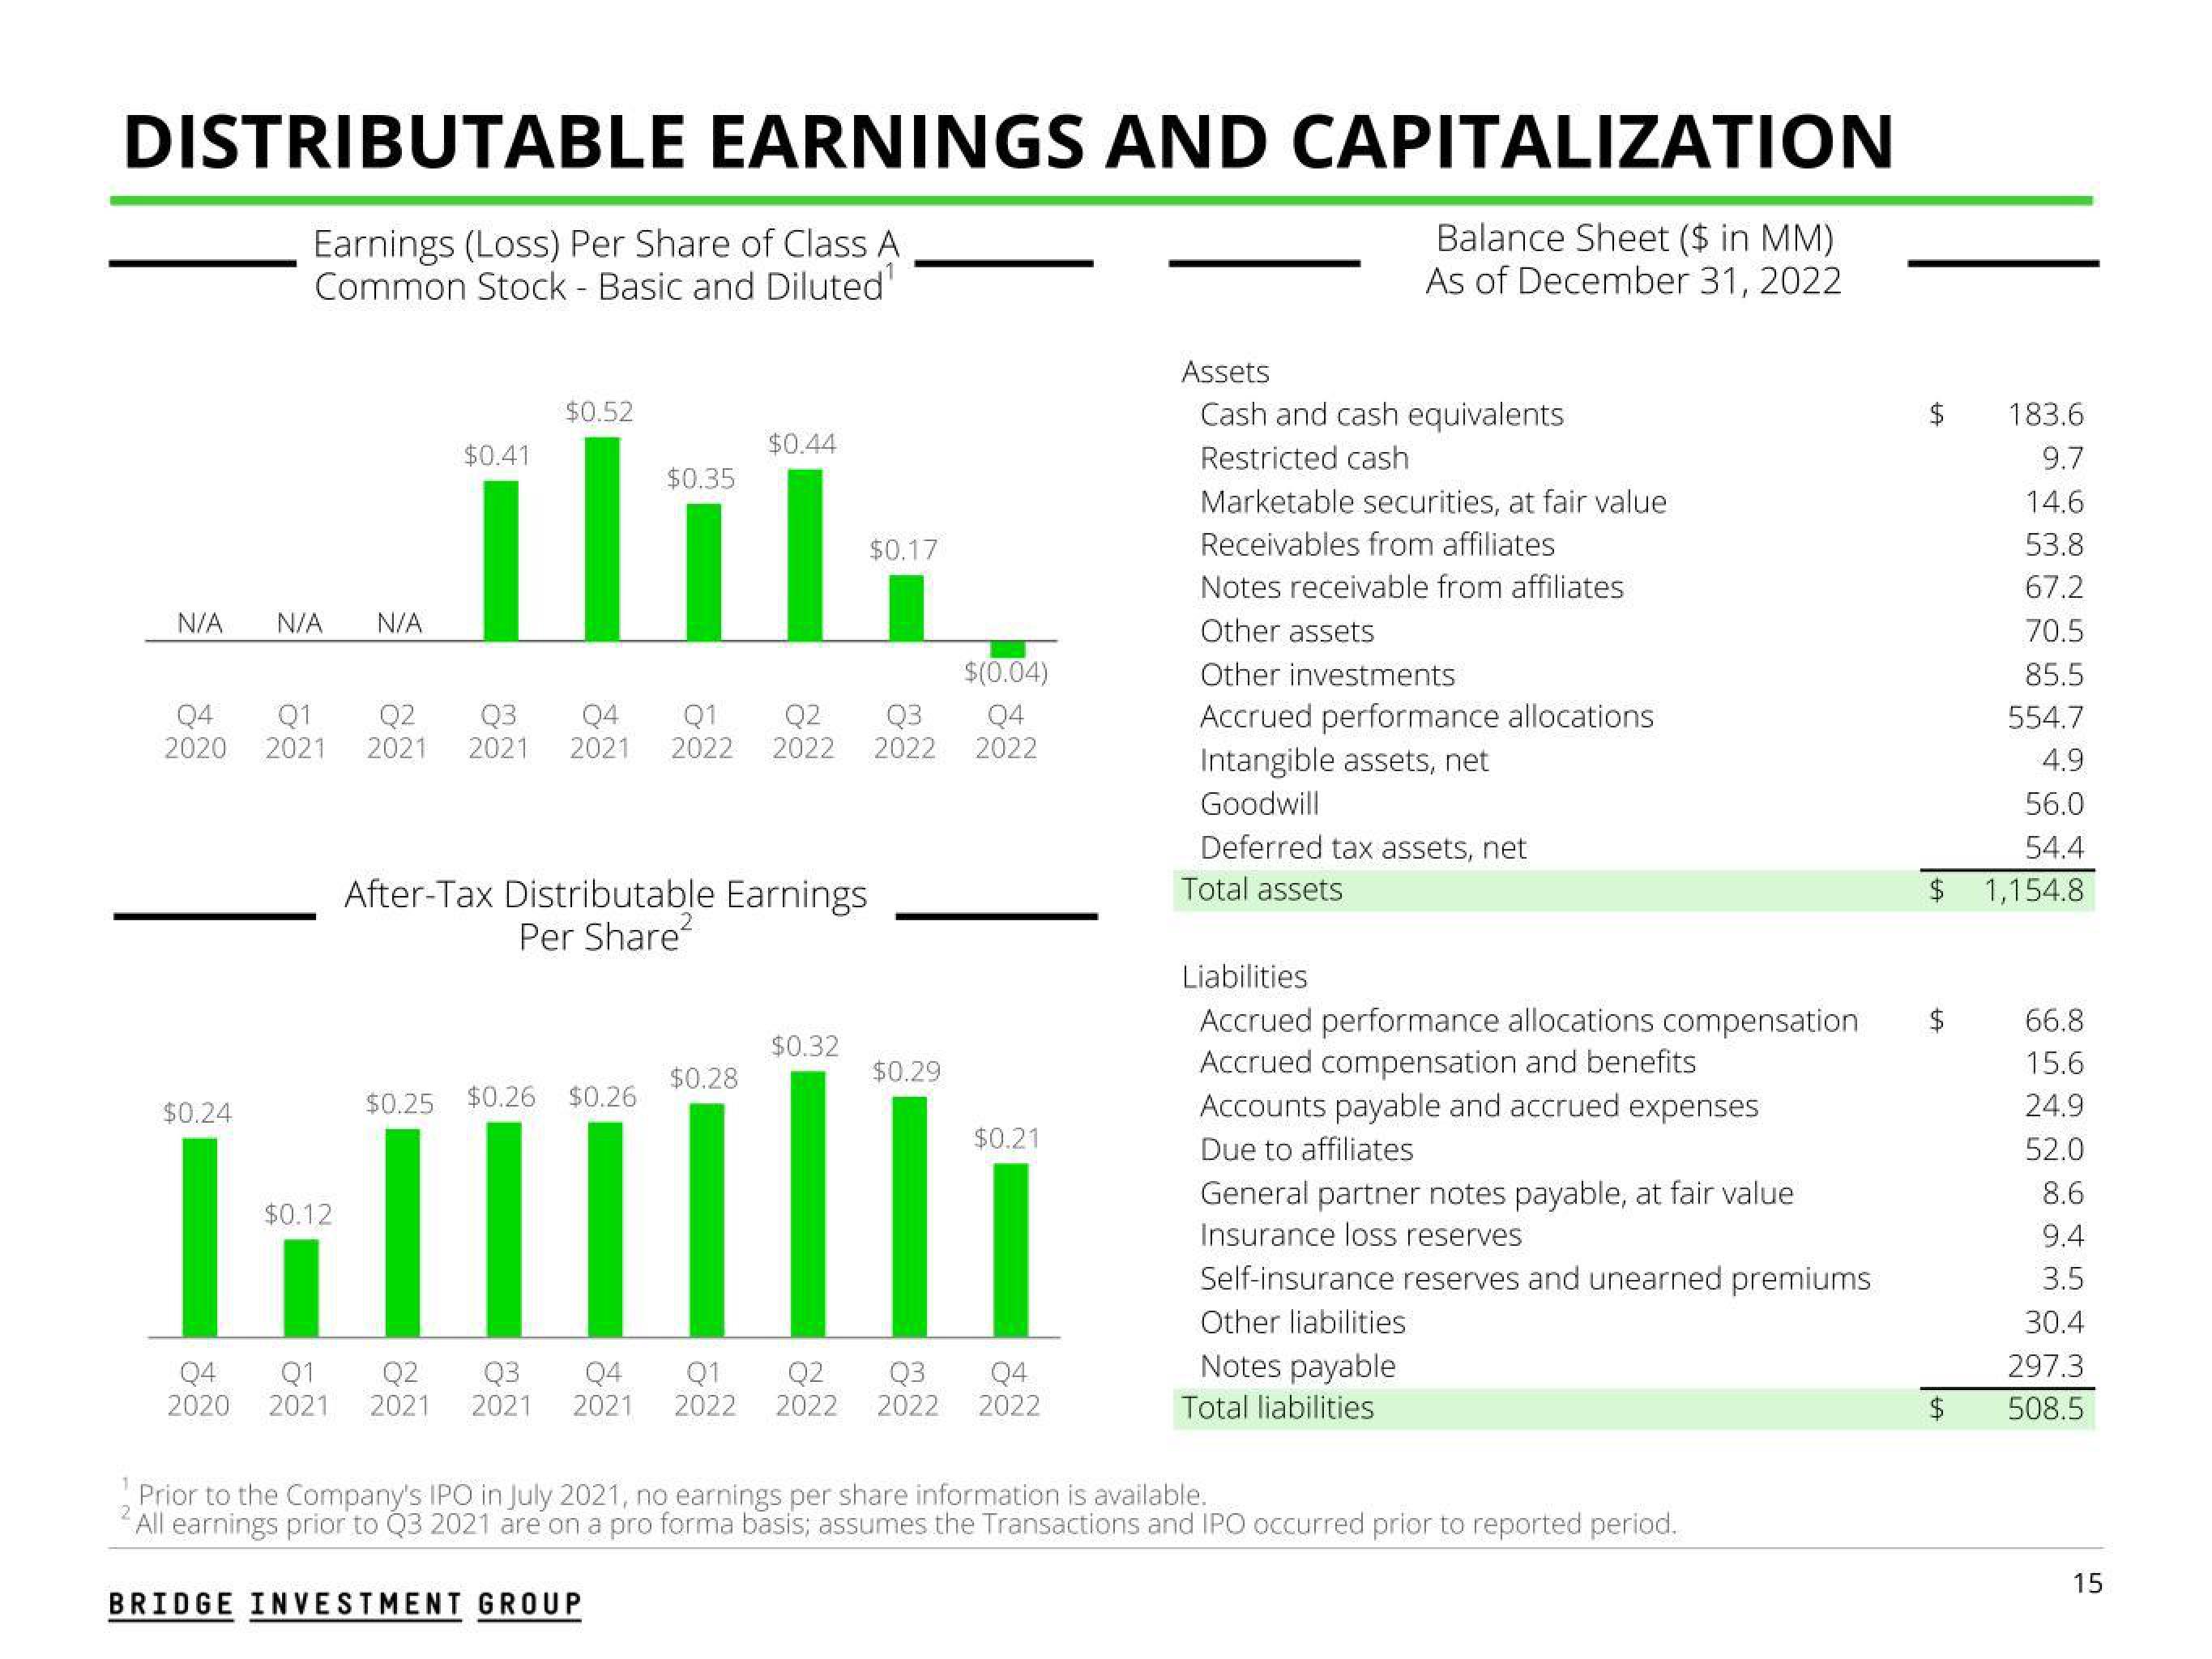
DISTRIBUTABLE EARNINGS AND CAPITALIZATION
Balance Sheet ($ in MM)
Earnings (Loss) Per Share of Class A
Common Stock - Basic and Diluted¹
As of December 31, 2022
N/A
N/A N/A
$0.24
$0.41
$0.52
Q4 Q1 Q2 Q3 Q4 Q1
2020
$0.12
$(0.04)
Q2 Q3
Q4
2021 2021 2021 2021 2022 2022 2022 2022
All
$0.25 $0.26 $0.26
$0.44
I
$0.35
After-Tax Distributable Earnings
Per Share²
BRIDGE INVESTMENT GROUP
$0.17
$0.28
$0.32
$0.29
$0.21
Q2
Q3
Q4
Q4 Q1
Q4 Q1 Q2 Q3
2020 2021 2021 2021 2021 2022 2022 2022 2022
Assets
Cash and cash equivalents
Restricted cash
Marketable securities, at fair value
Receivables from affiliates
Notes receivable from affiliates
Other assets
Other investments
Accrued performance allocations
Intangible assets, net
Goodwill
Deferred tax assets, net
Total assets
Liabilities
Accrued performance allocations compensation
Accrued compensation and benefits
Accounts payable and accrued expenses
Due to affiliates
General partner notes payable, at fair value
Insurance loss reserves
Self-insurance reserves and unearned premiums
Other liabilities
Notes payable
Total liabilities
Prior to the Company's IPO in July 2021, no earnings per share information is available.
All earnings prior to Q3 2021 are on a pro forma basis; assumes the Transactions and IPO occurred prior to reported period.
LA
$
183.6
9.7
14.6
53.8
67.2
70.5
85.5
554.7
4.9
56.0
54.4
1,154.8
66.8
15.6
24.9
52.0
8.6
9.4
3.5
30.4
297.3
508.5
15View entire presentation