Fastly Investor Presentation Deck
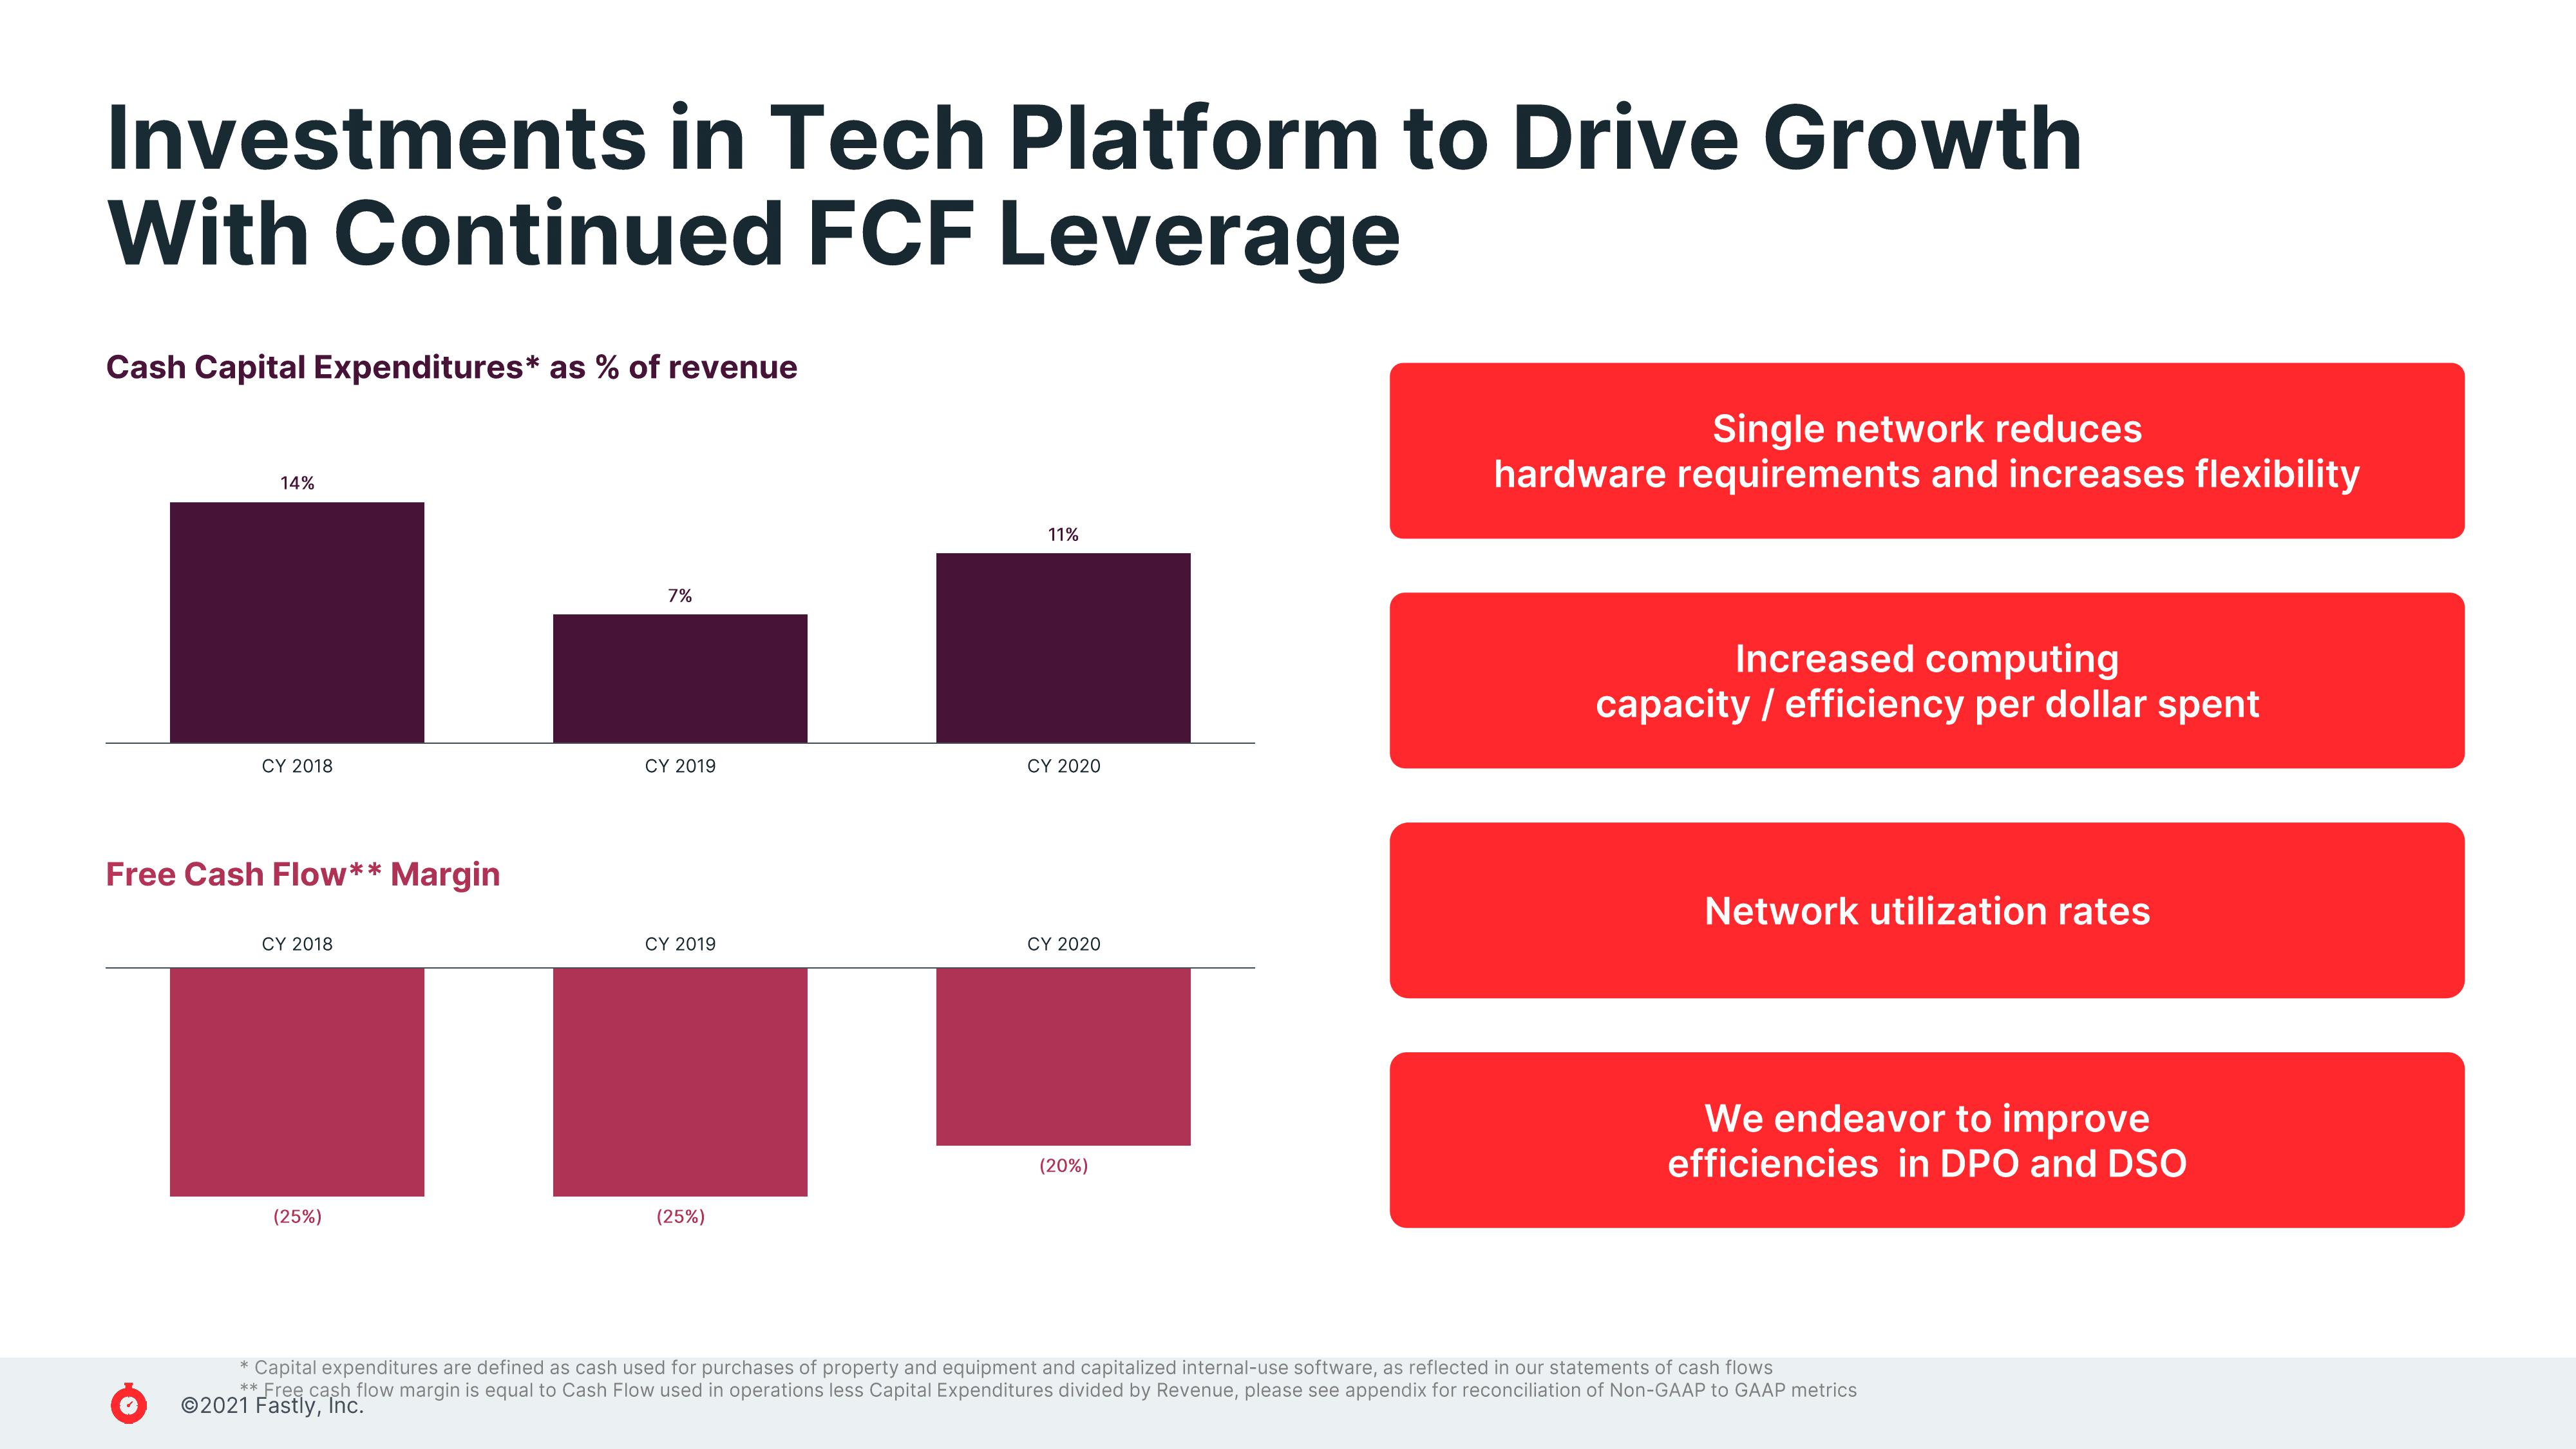
Investments in Tech Platform to Drive Growth
With Continued FCF Leverage
Cash Capital Expenditures* as % of revenue
14%
CY 2018
Free Cash Flow** Margin
CY 2018
(25%)
7%
CY 2019
CY 2019
(25%)
11%
CY 2020
CY 2020
(20%)
Single network reduces
hardware requirements and increases flexibility
Increased computing
capacity / efficiency per dollar spent
Network utilization rates
We endeavor to improve
efficiencies in DPO and DSO
* Capital expenditures are defined as cash used for purchases of property and equipment and capitalized internal-use software, as reflected in our statements of cash flows
**Free cash flow margin is equal to Cash Flow used in operations less Capital Expenditures divided by Revenue, please see appendix for reconciliation of Non-GAAP to GAAP metrics
2021 Fastly, Inc.View entire presentation