TPG Results Presentation Deck
Pro Forma Non-GAAP Financial Measures
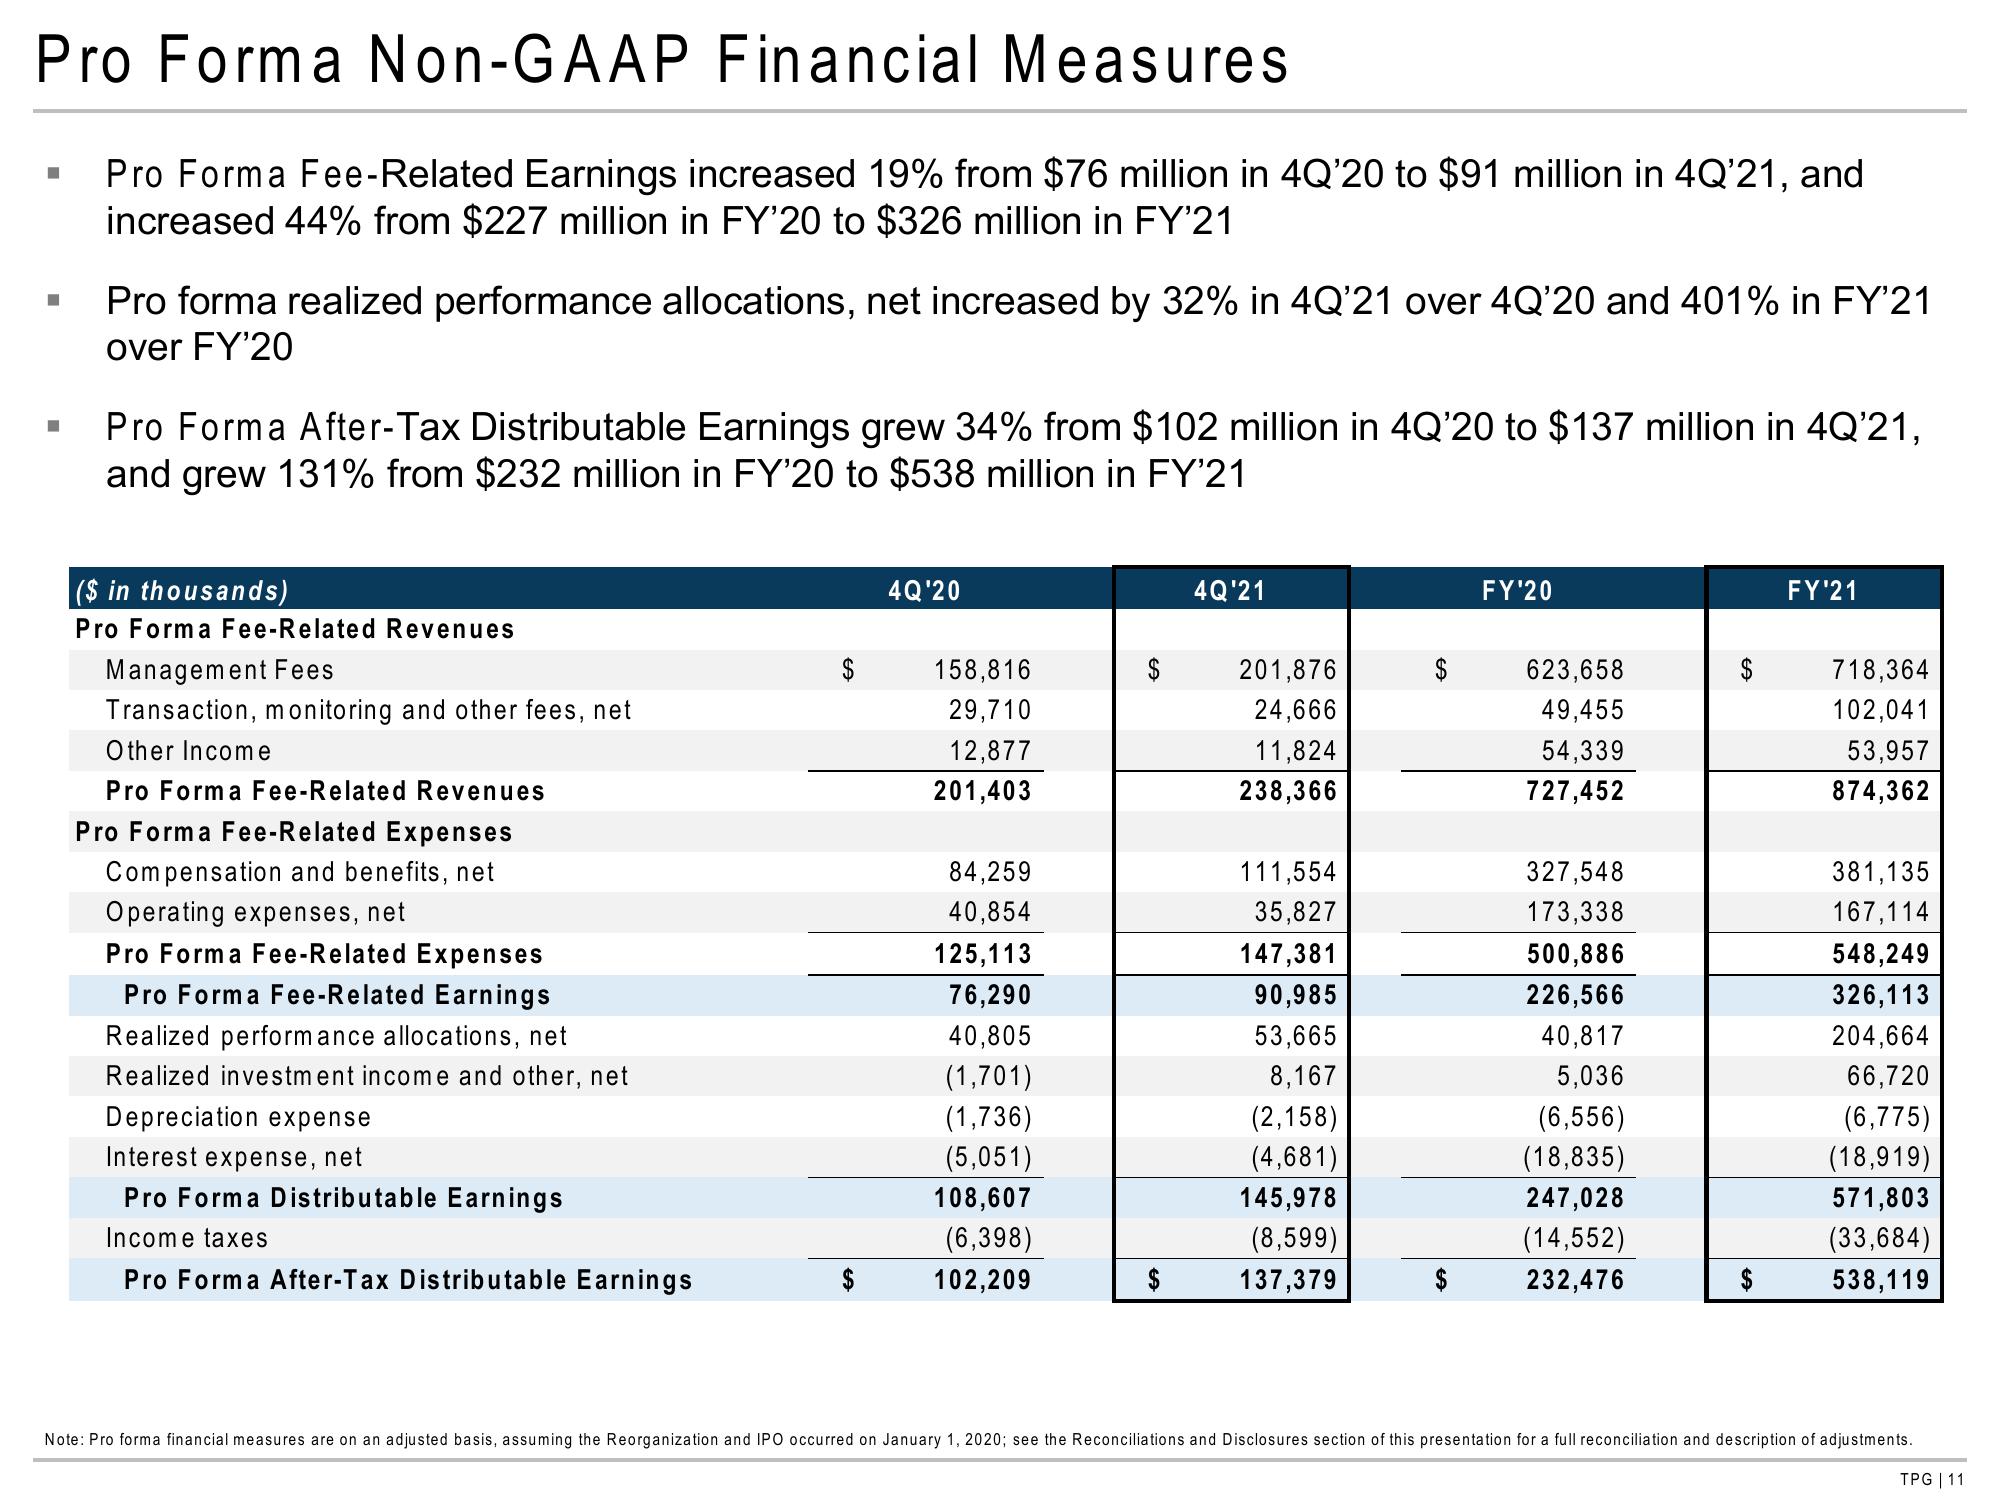
Pro Forma Fee-Related Earnings increased 19% from $76 million in 4Q'20 to $91 million in 4Q'21, and
increased 44% from $227 million in FY'20 to $326 million in FY'21
■
■
■
Pro forma realized performance allocations, net increased by 32% in 4Q'21 over 4Q'20 and 401% in FY'21
over FY'20
Pro Forma After-Tax Distributable Earnings grew 34% from $102 million in 4Q'20 to $137 million in 4Q'21,
and grew 131% from $232 million in FY'20 to $538 million in FY'21
($ in thousands)
Pro Forma Fee-Related Revenues
Management Fees
Transaction, monitoring and other fees, net
Other Income
Pro Forma Fee-Related Revenues
Pro Forma Fee-Related Expenses
Compensation and benefits, net
Operating expenses, net
Pro Forma Fee-Related Expenses
Pro Forma Fee-Related Earnings
Realized performance allocations, net
Realized investment income and other, net
Depreciation expense
Interest expense, net
Pro Forma Distributable Earnings
Income taxes
Pro Forma After-Tax Distributable Earnings
4Q'20
158,816
29,710
12,877
201,403
84,259
40,854
125,113
76,290
40,805
(1,701)
(1,736)
(5,051)
108,607
(6,398)
102,209
$
4Q'21
201,876
24,666
11,824
238,366
111,554
35,827
147,381
90,985
53,665
8,167
(2,158)
(4,681)
145,978
(8,599)
137,379
FY'20
623,658
49,455
54,339
727,452
327,548
173,338
500,886
226,566
40,817
5,036
(6,556)
(18,835)
247,028
(14,552)
232,476
$
$
FY'21
718,364
102,041
53,957
874,362
381,135
167,114
548,249
326,113
204,664
66,720
(6,775)
(18,919)
571,803
(33,684)
538,119
Note: Pro forma financial measures are on an adjusted basis, assuming the Reorganization and IPO occurred on January 1, 2020; see the Reconciliations and Disclosures section of this presentation for a full reconciliation and description of adjustments.
TPG | 11View entire presentation