WeWork Investor Presentation Deck
Key Performance Indicators
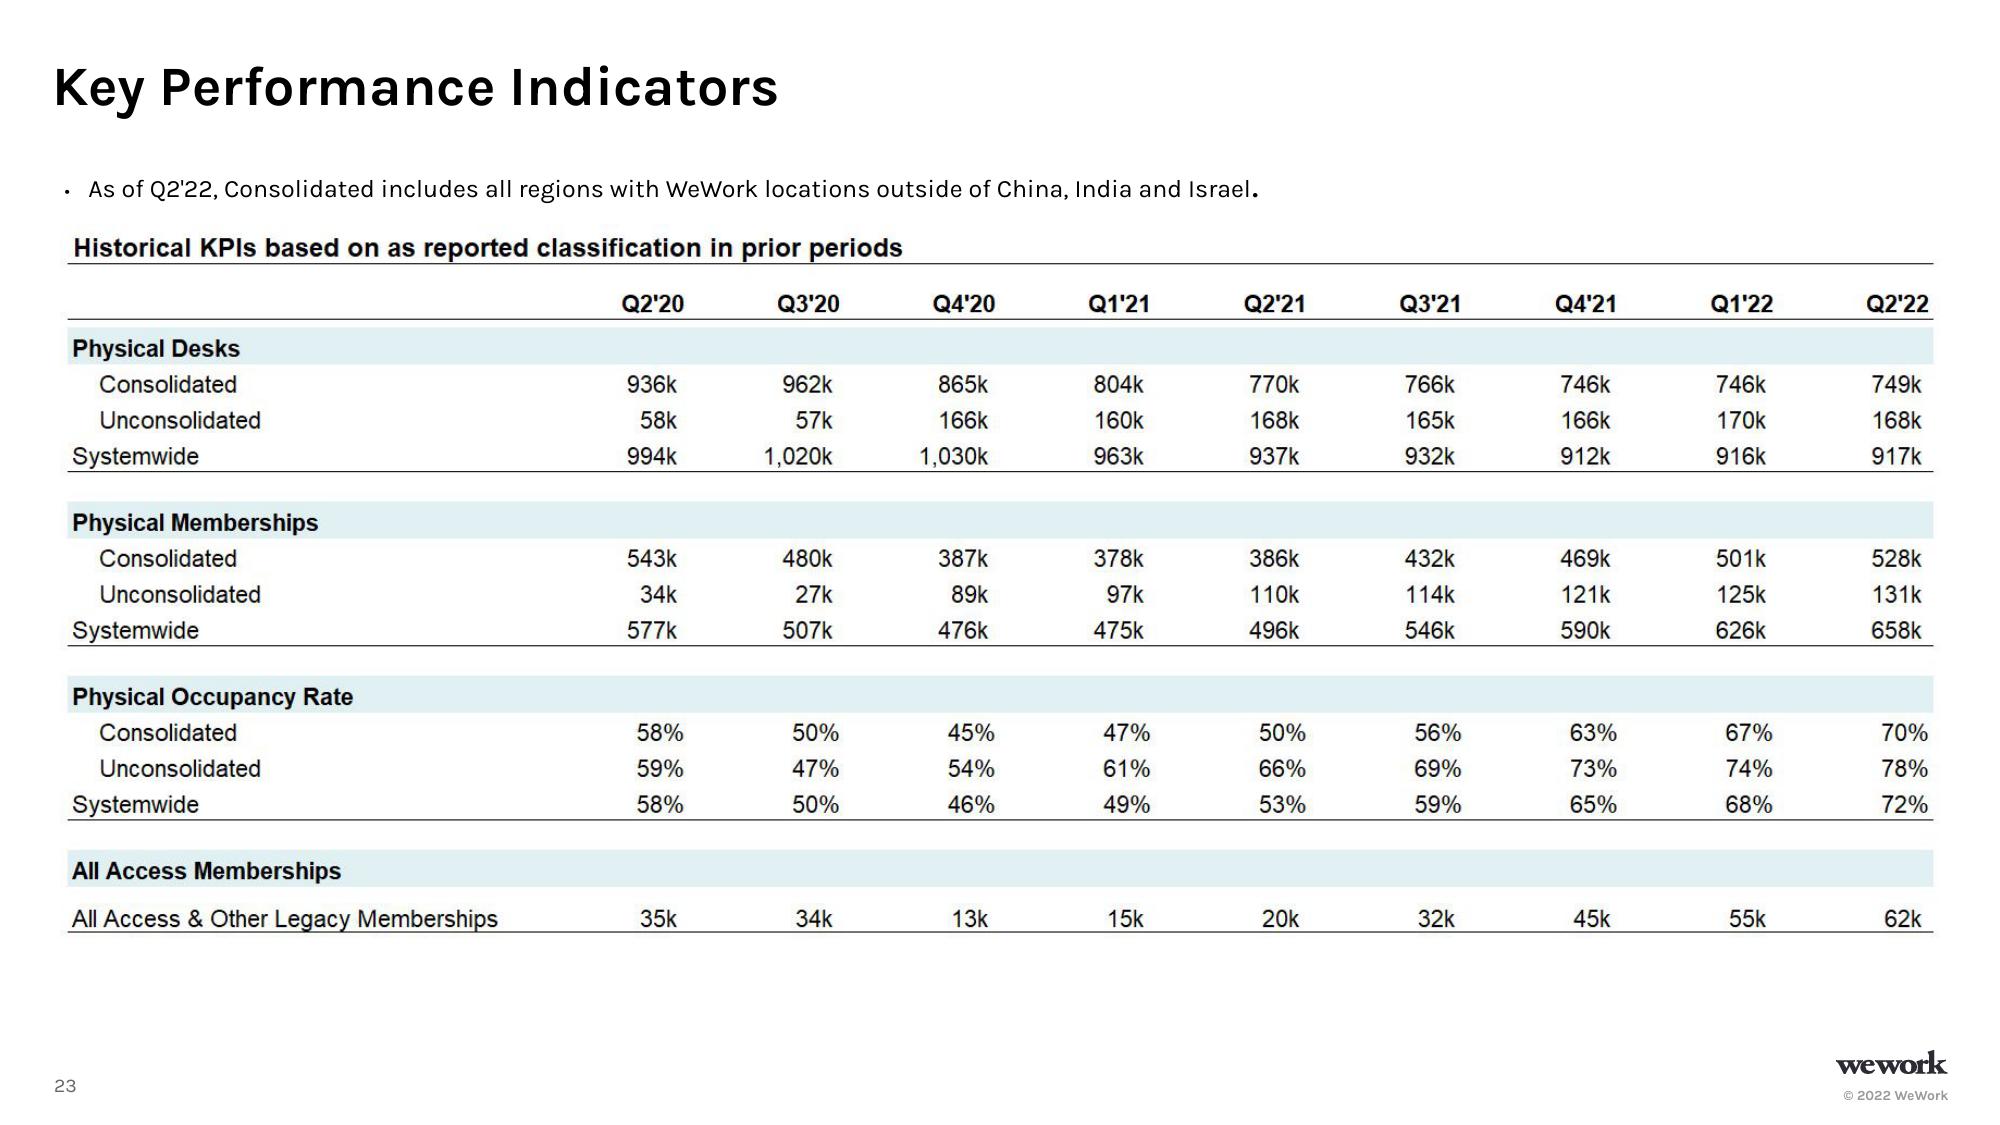
As of Q2'22, Consolidated includes all regions with WeWork locations outside of China, India and Israel.
Historical KPIs based on as reported classification in prior periods
Physical Desks
Consolidated
Unconsolidated
Systemwide
Physical Memberships
Consolidated
Unconsolidated
Systemwide
Physical Occupancy Rate
Consolidated
Unconsolidated
Systemwide
23
All Access Memberships
All Access & Other Legacy Memberships
Q2'20
936k
58k
994k
543k
34k
577k
58%
59%
58%
35k
Q3'20
962k
57k
1,020k
480k
27k
507k
50%
47%
50%
34k
Q4'20
865k
166k
1,030k
387k
89k
476k
45%
54%
46%
13k
Q1'21
804k
160k
963k
378k
97k
475k
47%
61%
49%
15k
Q2'21
770k
168k
937k
386k
110k
496k
50%
66%
53%
20k
Q3'21
766k
165k
932k
432k
114k
546k
56%
69%
59%
32k
Q4'21
746k
166k
912k
469k
121k
590k
63%
73%
65%
45k
Q1'22
746k
170k
916k
501k
125k
626k
67%
74%
68%
55k
Q2'22
749k
168k
917k
528k
131k
658k
70%
78%
72%
62k
wework
Ⓒ2022 WeWorkView entire presentation