Cameco IPO Presentation Deck
Expect Partnership to Enhance
Cameco's Financial Profile and
Diversify Business Mix
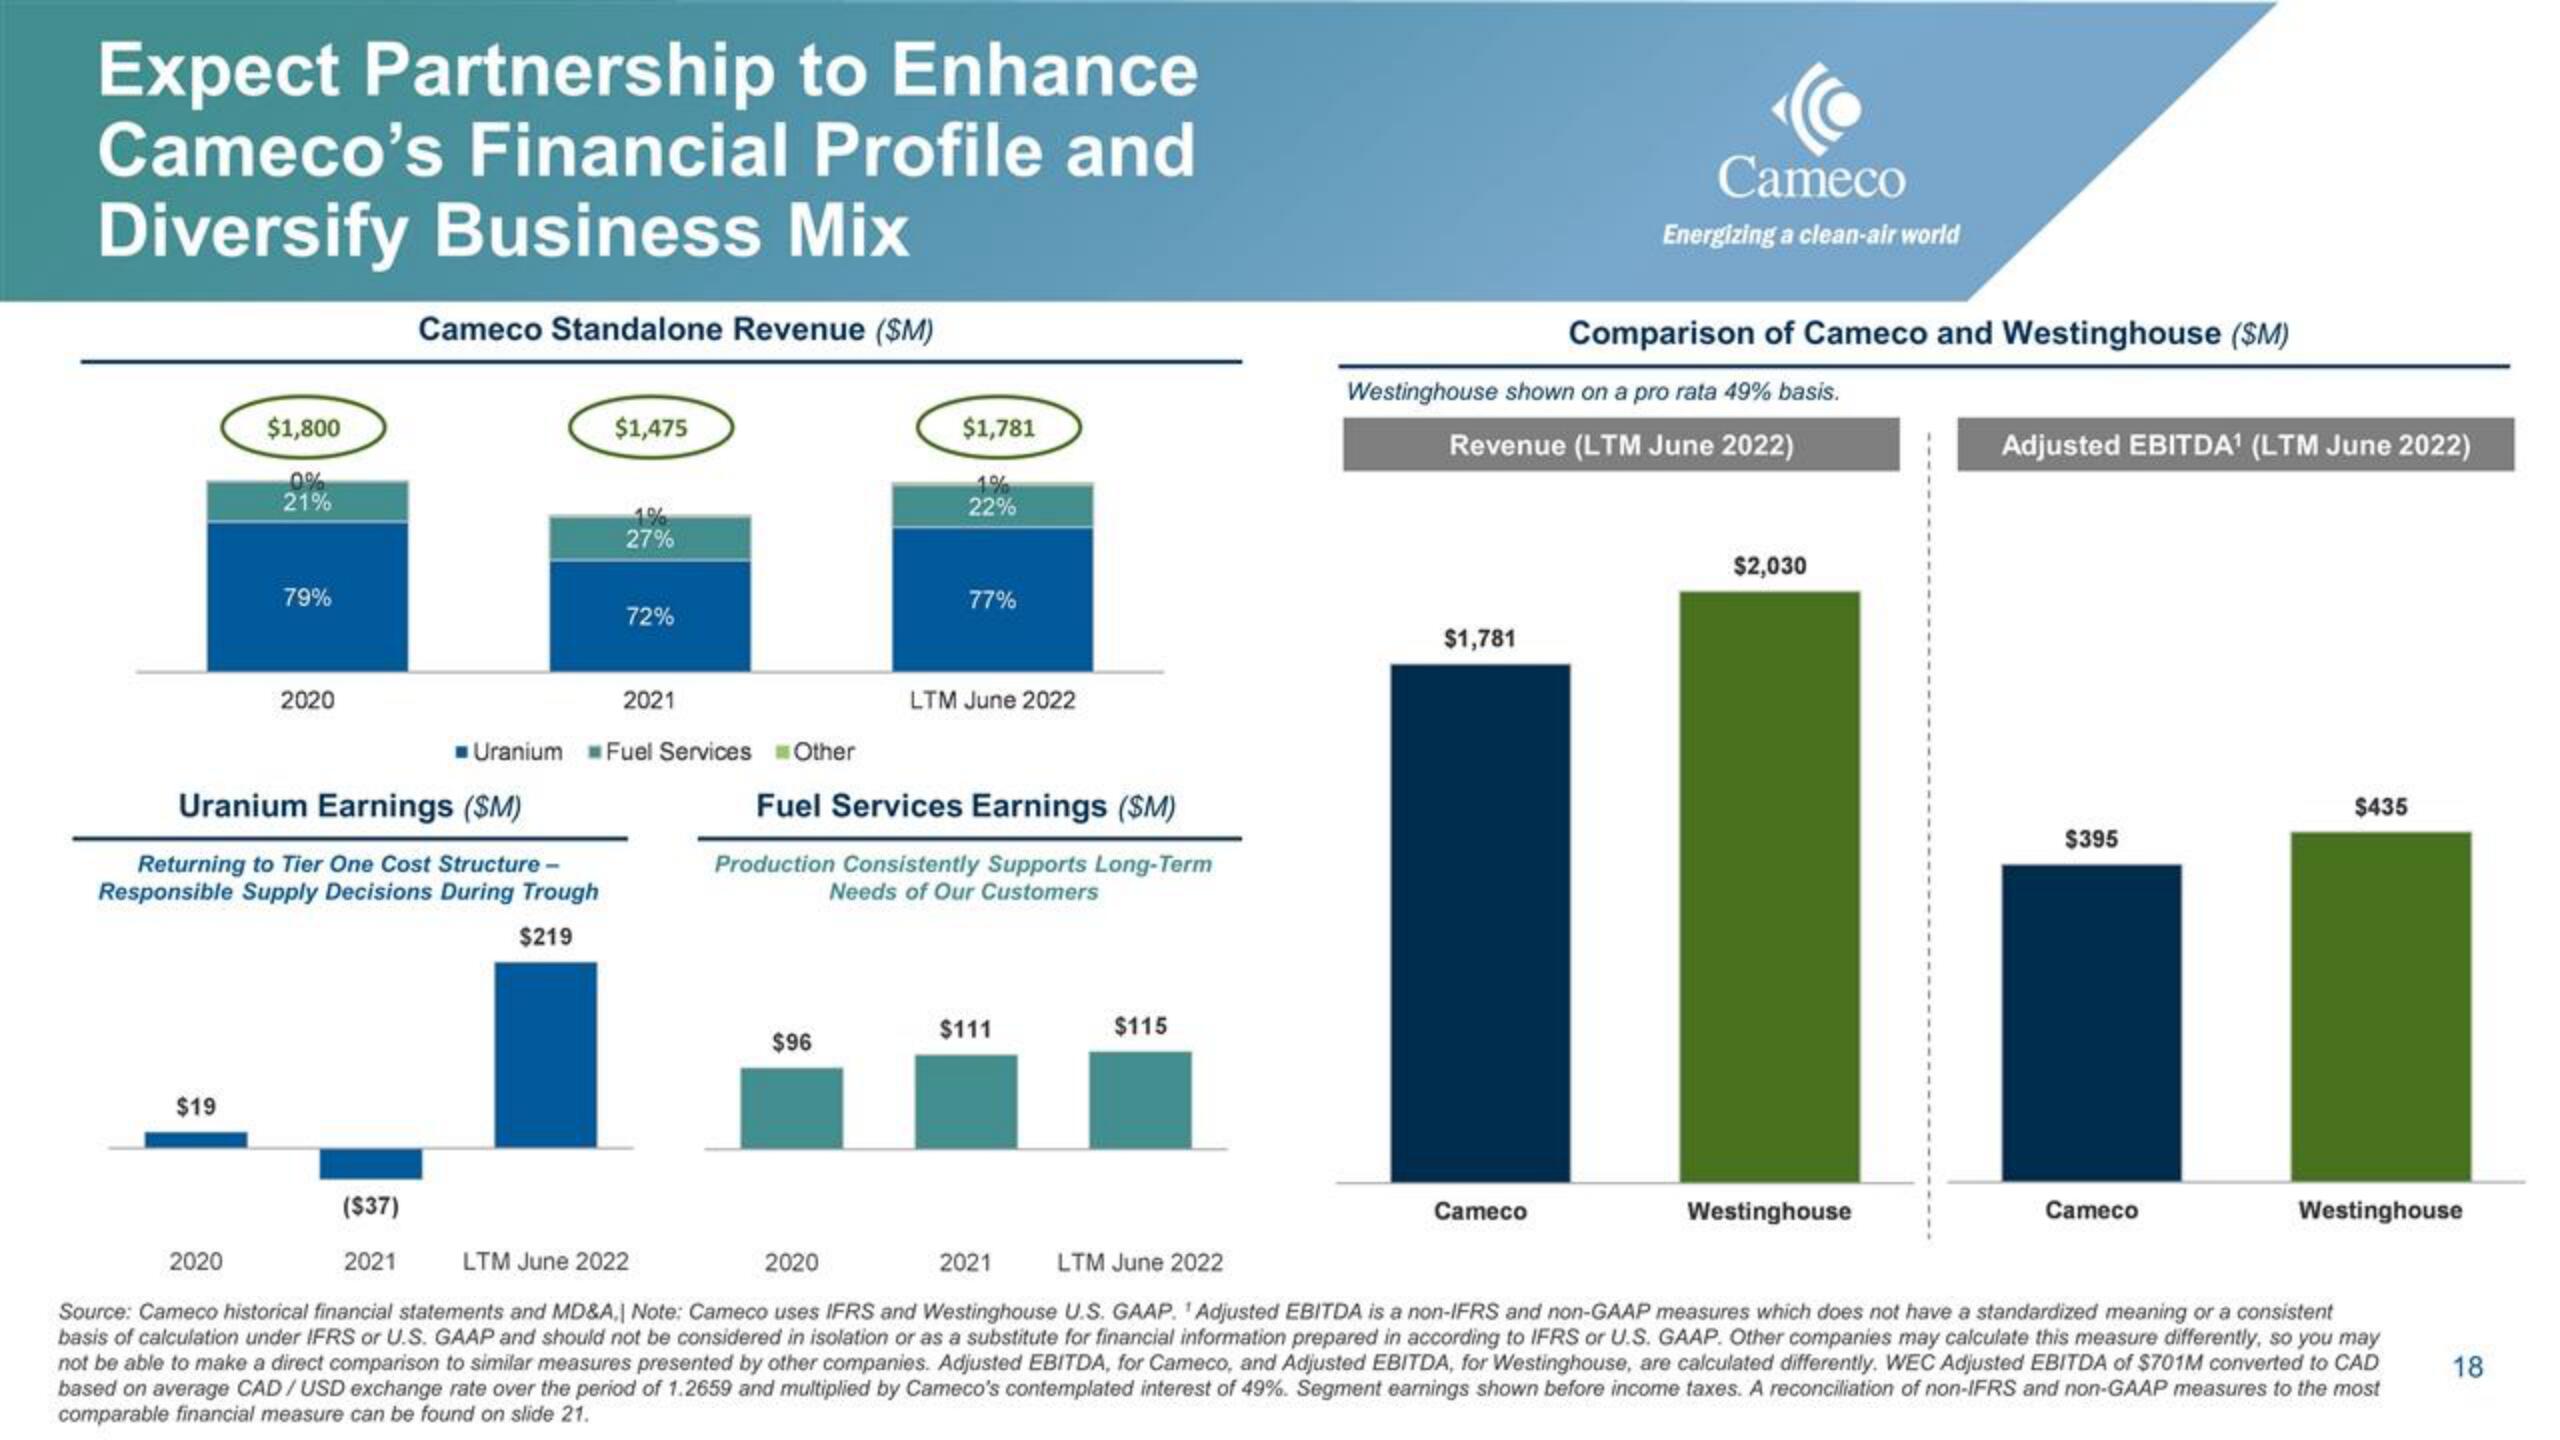
Cameco Standalone Revenue (SM)
$1,800
$19
0%
21%
79%
2020
Uranium Earnings (SM)
Returning to Tier One Cost Structure-
Responsible Supply Decisions During Trough
$219
$1,475
1%
27%
72%
2021
Uranium Fuel Services Other
$1,781
$96
22%
77%
LTM June 2022
Fuel Services Earnings (SM)
Production Consistently Supports Long-Term
Needs of Our Customers
$111
$115
$1,781
Cameco
Energizing a clean-air world
Westinghouse shown on a pro rata 49% basis.
Revenue (LTM June 2022)
Comparison of Cameco and Westinghouse (SM)
Cameco
$2,030
Adjusted EBITDA¹ (LTM June 2022)
Westinghouse
$395
($37)
LTM June 2022
2020
2021
LTM June 2022
2020
2021
Source: Cameco historical financial statements and MD&A,| Note: Cameco uses IFRS and Westinghouse U.S. GAAP. 'Adjusted EBITDA is a non-IFRS and non-GAAP measures which does not have a standardized meaning or a consistent
basis of calculation under IFRS or U.S. GAAP and should not be considered in isolation or as a substitute for financial information prepared in according to IFRS or U.S. GAAP. Other companies may calculate this measure differently, so you may
not be able to make a direct comparison to similar measures presented by other companies. Adjusted EBITDA, for Cameco, and Adjusted EBITDA, for Westinghouse, are calculated differently. WEC Adjusted EBITDA of $701M converted to CAD
based on average CAD/USD exchange rate over the period of 1.2659 and multiplied by Cameco's contemplated interest of 49%. Segment earnings shown before income taxes. A reconciliation of non-IFRS and non-GAAP measures to the most
comparable financial measure can be found on slide 21.
$435
Cameco
Westinghouse
18View entire presentation