Sonos Investor Presentation Deck
NEW: A Detailed Look at Customer Behavior and Install Base Monetization Over Time
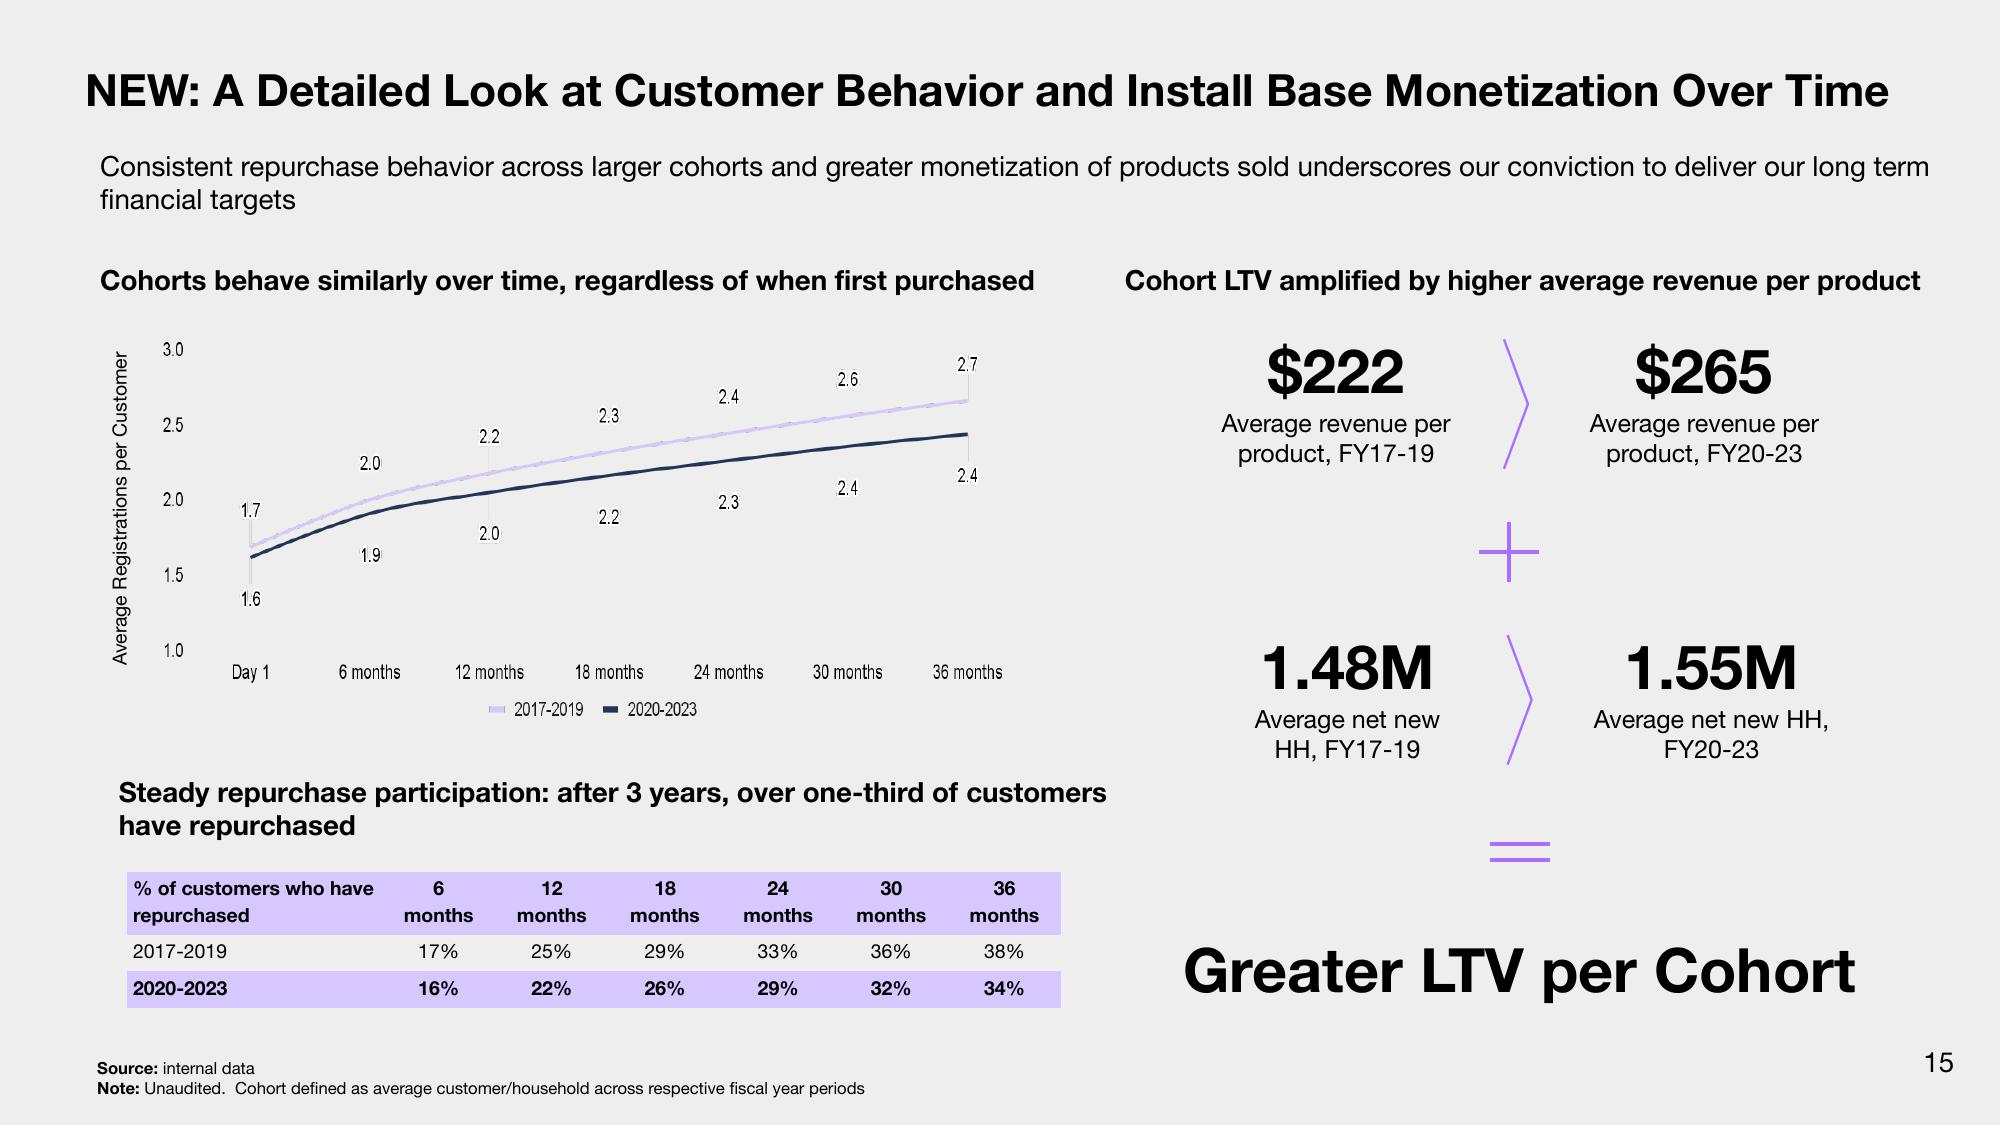
Consistent repurchase behavior across larger cohorts and greater monetization of products sold underscores our conviction to deliver our long term
financial targets
Cohorts behave similarly over time, regardless of when first purchased
Average Registrations per Customer
3.0
2.5
2.0
1.5
1.0
1.7
1.6
Day 1
2.0
1.9
6 months
% of customers who have
repurchased
2017-2019
2020-2023
2.2
2.0
12 months
6
months
17%
16%
2.3
2.2
18 months
12
months
25%
22%
2017-2019 -2020-2023
2.4
24 months
2.3
18
months
29%
26%
2.6
2.4
30 months
Steady repurchase participation: after 3 years, over one-third of customers
have repurchased
24
months
33%
29%
30
months
36%
32%
2.7
Source: internal data
Note: Unaudited. Cohort defined as average customer/household across respective fiscal year periods
2.4
36 months
36
months
38%
34%
Cohort LTV amplified by higher average revenue per product
$222
$265
Average revenue per
product, FY17-19
Average revenue per
product, FY20-23
1.48M
Average net new
HH, FY17-19
+
1.55M
Average net new HH,
FY20-23
Greater LTV per Cohort
15View entire presentation