Waldencast 2Q22 Investor Results
Net sales
($mm)
Gross profit
($mm)
Pro Forma
Adj. EBITDA
($mm)
OBAGI
Milk
Waldencast
OBAGI
GM %
Milk
GM %
Waldencast
GM %
OBAGI
Adj EBITDA %
Milk
Adj EBITDA %
Central costs ²
Adj EBITDA %
Waldencast
Adj EBITDA %
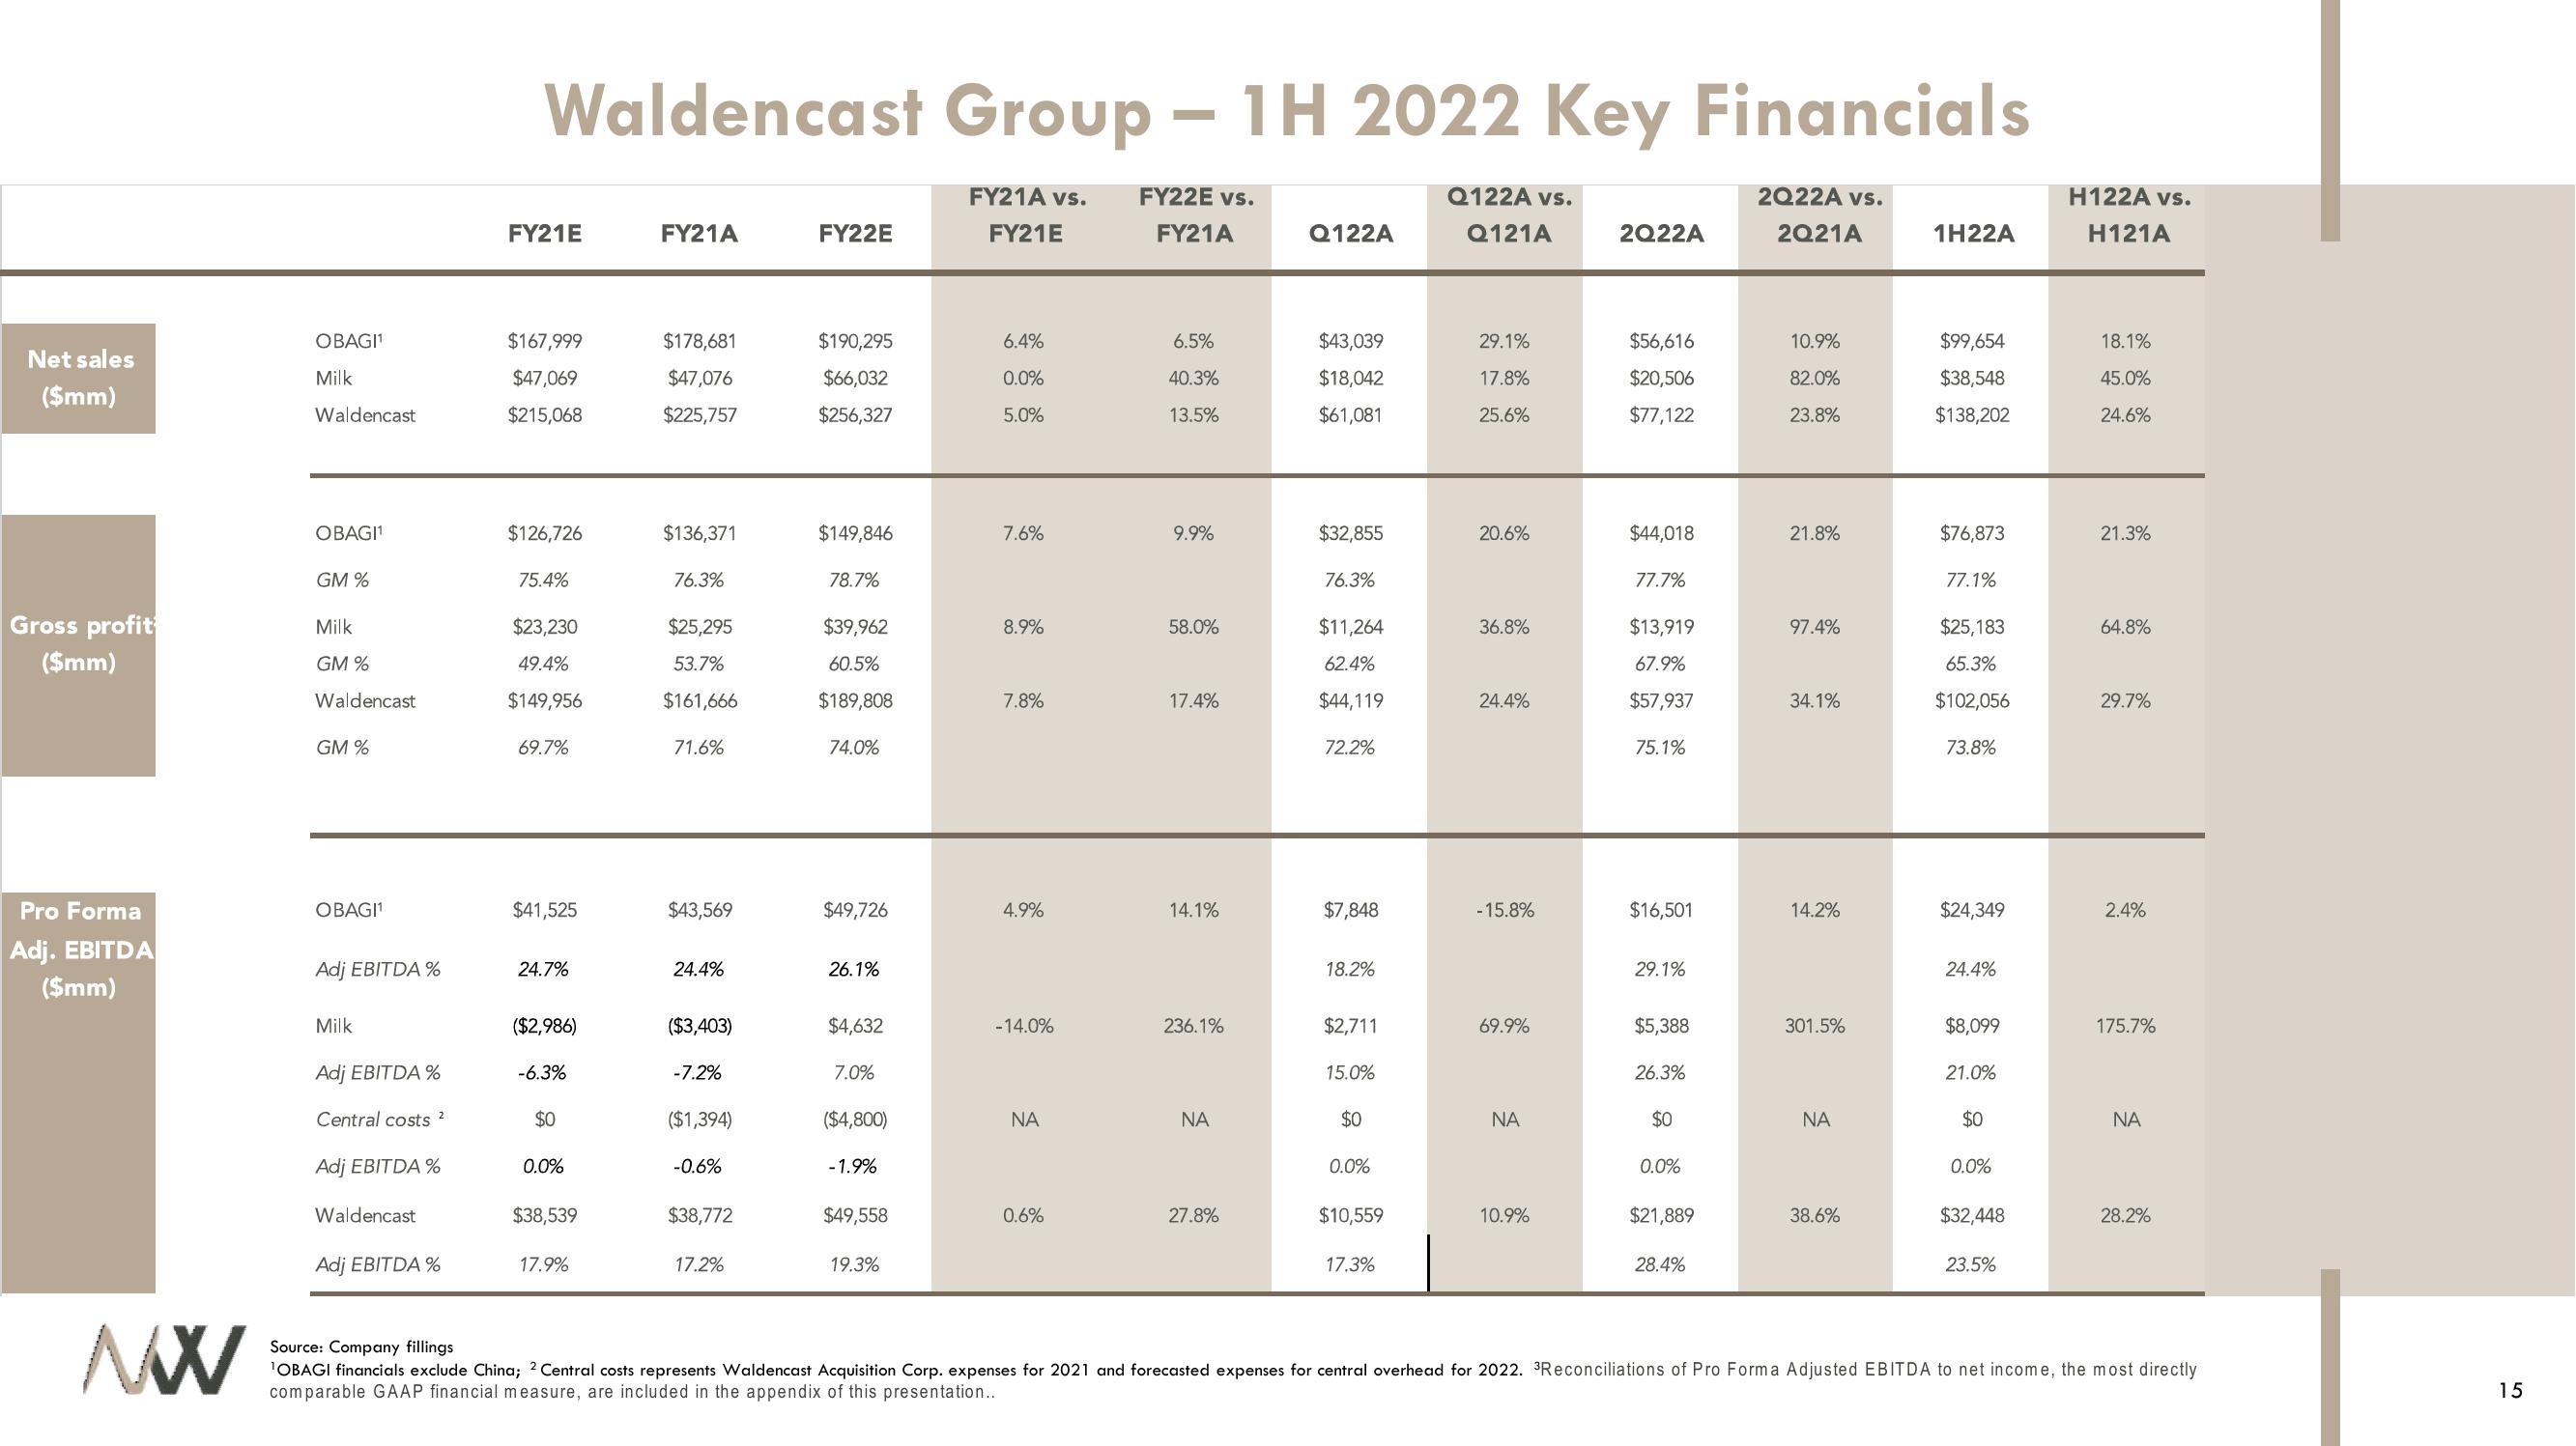
Waldencast Group - 1H 2022 Key Financials
FY21A vs.
FY21E
FY22E vs.
FY21A
FY21E
$167,999
$47,069
$215,068
$126,726
75.4%
$23,230
49.4%
$149,956
69.7%
$41,525
24.7%
($2,986)
-6.3%
$0
0.0%
$38,539
17.9%
FY21A
$178,681
$47,076
$225,757
$136,371
76.3%
$25,295
53.7%
$161,666
71.6%
$43,569
24.4%
($3,403)
-7.2%
($1,394)
-0.6%
$38,772
17.2%
FY22E
$190,295
$66,032
$256,327
$149,846
78.7%
$39,962
60.5%
$189,808
74.0%
$49,726
26.1%
$4,632
7.0%
($4,800)
-1.9%
$49,558
19.3%
6.4%
0.0%
5.0%
7.6%
8.9%
7.8%
4.9%
-14.0%
ΝΑ
0.6%
6.5%
40.3%
13.5%
9.9%
58.0%
17.4%
14.1%
236.1%
ΝΑ
27.8%
Q122A
$43,039
$18,042
$61,081
$32,855
76.3%
$11,264
62.4%
$44,119
72.2%
$7,848
18.2%
$2,711
15.0%
$0
0.0%
$10,559
17.3%
Q122A vs.
Q121A
29.1%
17.8%
25.6%
20.6%
36.8%
24.4%
- 15.8%
69.9%
ΝΑ
10.9%
2Q22A
$56,616
$20,506
$77,122
$44,018
77.7%
$13,919
67.9%
$57,937
75.1%
$16,501
29.1%
$5,388
26.3%
$0
0.0%
$21,889
28.4%
2Q22A vs.
2Q21A
10.9%
82.0%
23.8%
21.8%
97.4%
34.1%
14.2%
301.5%
NA
38.6%
1H22A
$99,654
$38,548
$138,202
$76,873
77.1%
$25,183
65.3%
$102,056
73.8%
$24,349
24.4%
$8,099
21.0%
$0
0.0%
$32,448
23.5%
H122A vs.
H121A
18.1%
45.0%
24.6%
21.3%
64.8%
29.7%
2.4%
175.7%
ΝΑ
28.2%
MX
Source: Company fillings
¹OBAGI financials exclude China; 2 Central costs represents Waldencast Acquisition Corp. expenses for 2021 and forecasted expenses for central overhead for 2022. ³Reconciliations of Pro Forma Adjusted EBITDA to net income, the most directly
comparable GAAP financial measure, are included in the appendix of this presentation..
15View entire presentation