Bridge Investment Group Results Presentation Deck
FEE EARNING AUM DRIVERS
Capital Raised ($ in MM)
$1,657
$175
$1,137
Q4 Q1 Q2 Q3
2020 2021 2021 2021
Deployment ($ in MM)
$212
$1,056
$10.2 $10.3
$998
$1,493
Total AUM: $25 $26
$1,303
$10.8
$2,307
$12.1
$2,060
Q4 Q1 Q2 Q3
2021 2022 2022 2022
Fee-Earning Assets Under Management ($ in Bn)
$16.6
$14.7 $15.5
$13.4
$1,101
1
Q4 Q1 Q2
Q3
Q4
2020 2021 2021 2021 2021
$29 $32 $36
Q4 Q1 Q2 Q3 Q4 Q1 Q2 Q3 Q4
2020 2021 2021 2021 2021 2022 2022 2022 2022
$639
BRIDGE INVESTMENT GROUP
$1,498 $1,345
$938
Q1
2022
$39
$633
$518
Q4
2022
$980
$17.3
Q2 Q3 Q4
2022 2022 2022
$42 $44 $43
.
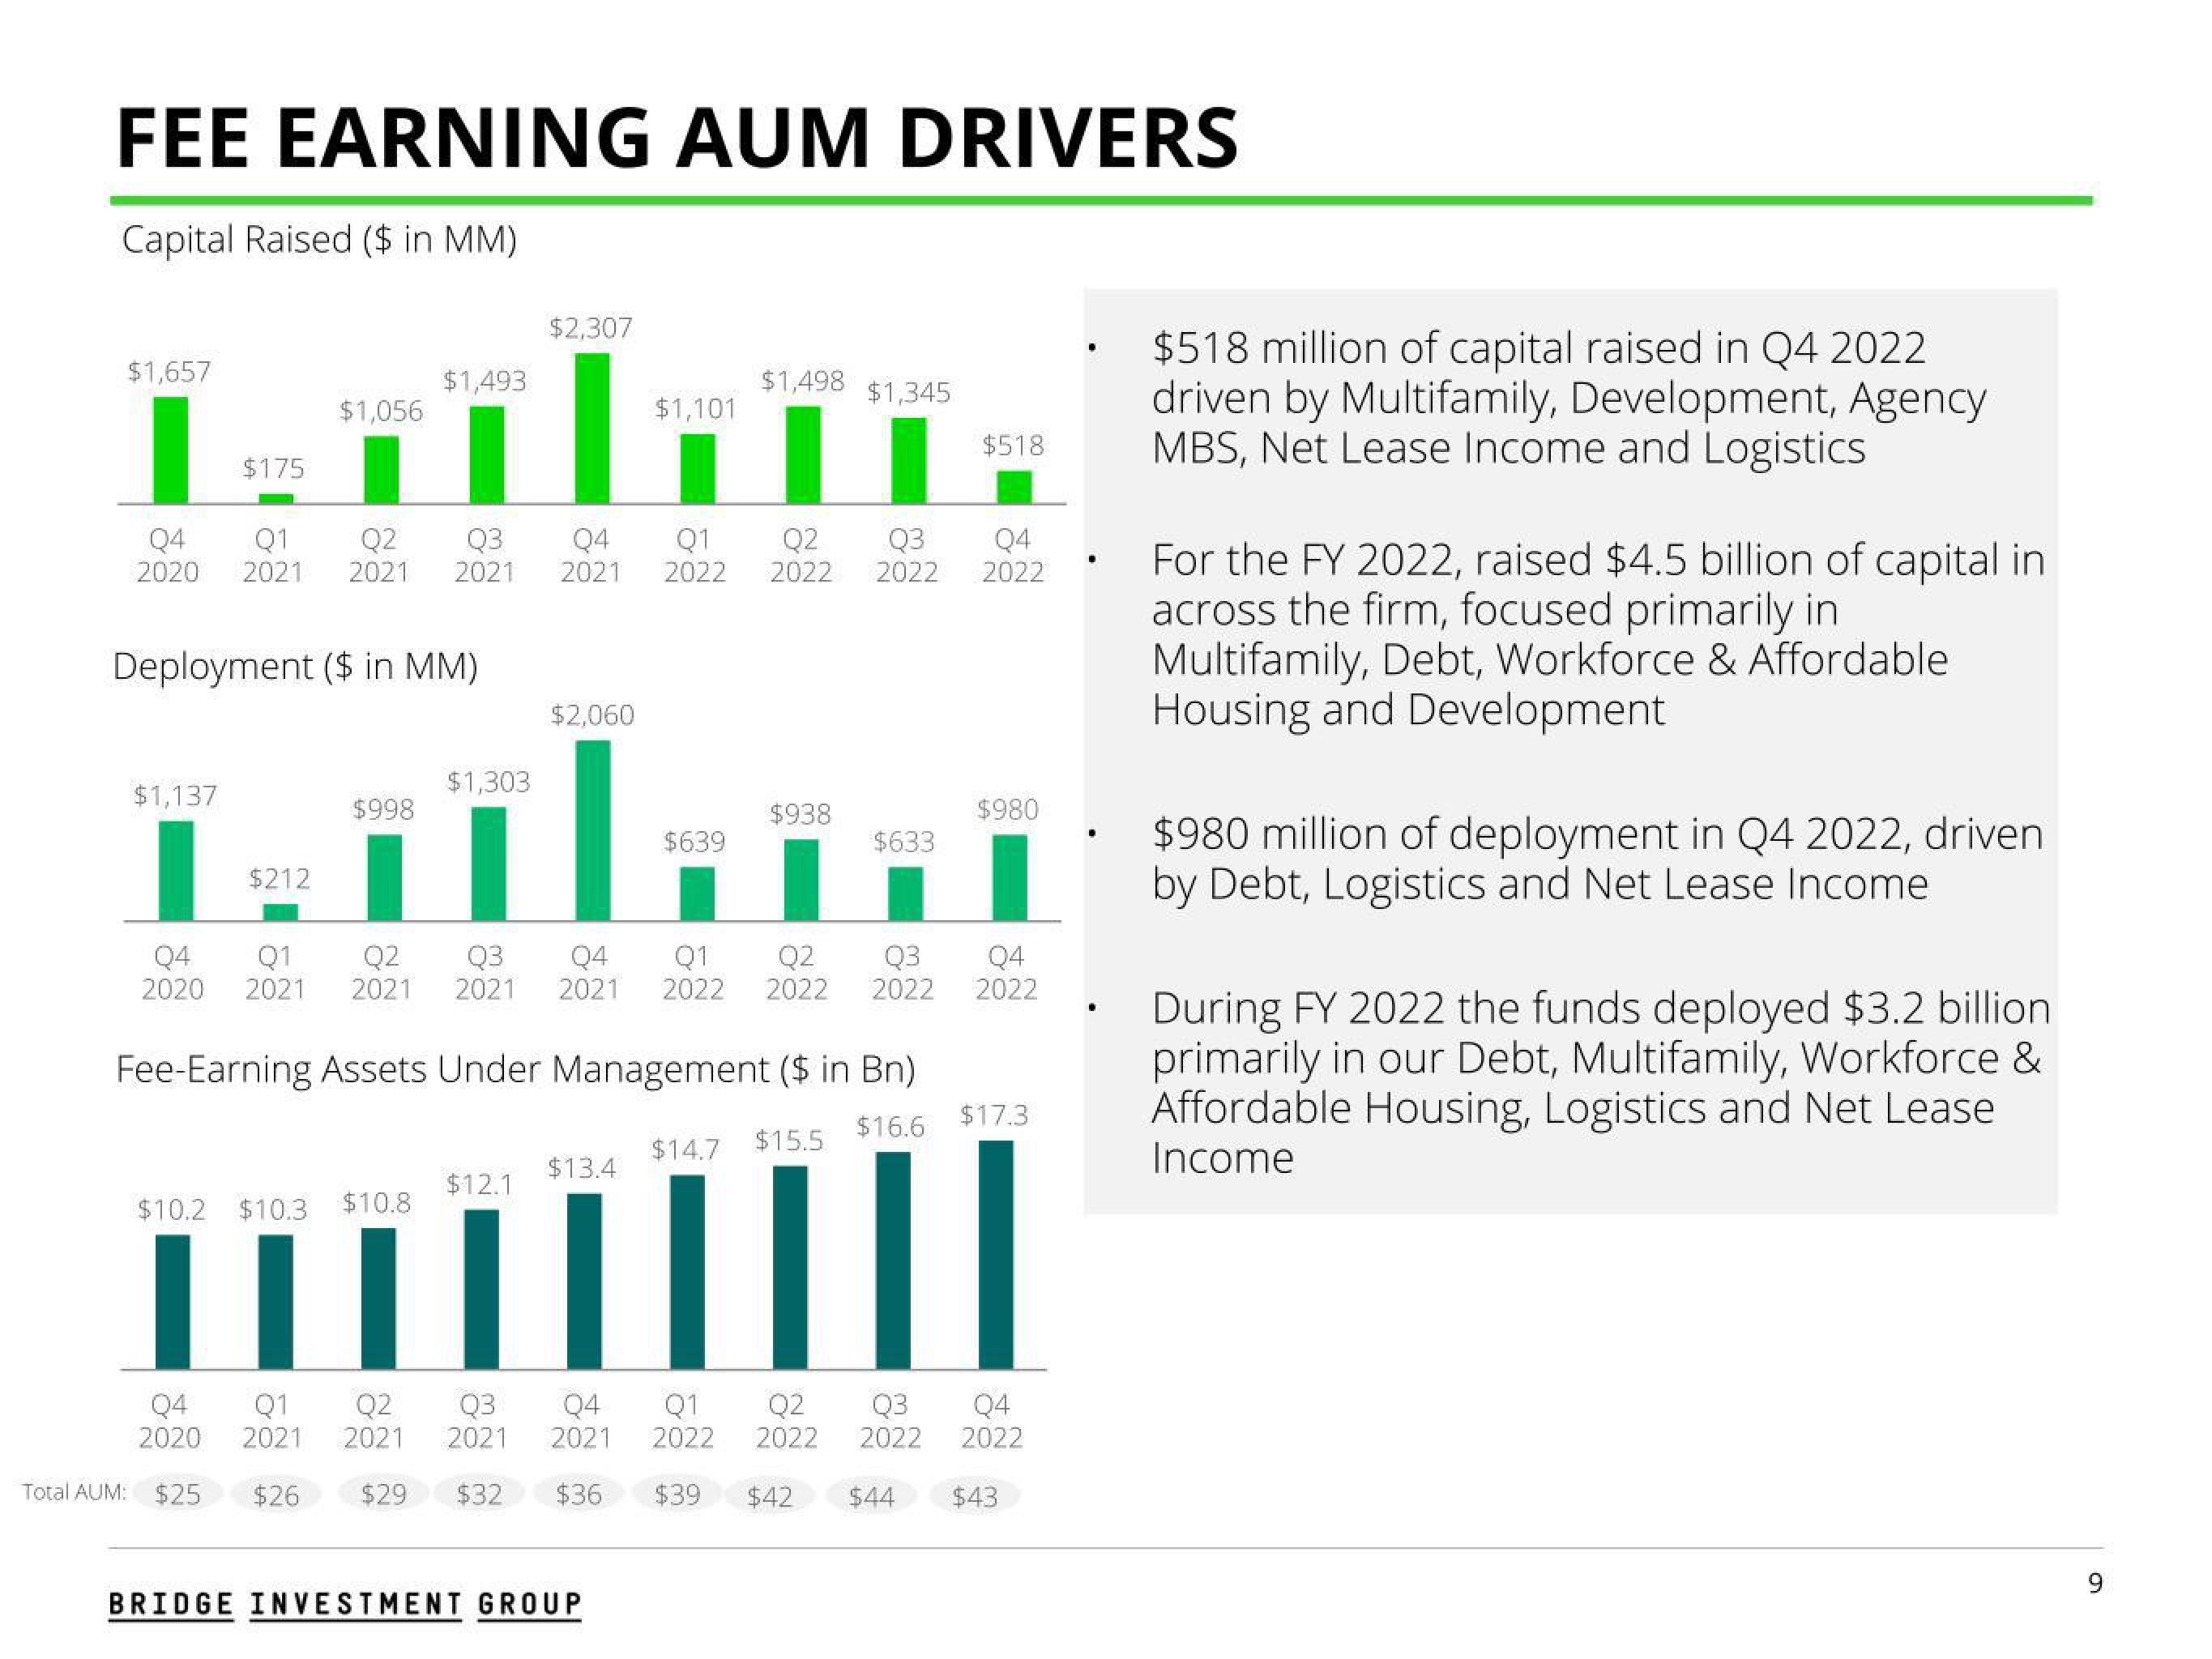
$518 million of capital raised in Q4 2022
driven by Multifamily, Development, Agency
MBS, Net Lease Income and Logistics
For the FY 2022, raised $4.5 billion of capital in
across the firm, focused primarily in
Multifamily, Debt, Workforce & Affordable
Housing and Development
$980 million of deployment in Q4 2022, driven
by Debt, Logistics and Net Lease Income
During FY 2022 the funds deployed $3.2 billion
primarily in our Debt, Multifamily, Workforce &
Affordable Housing, Logistics and Net Lease
Income
9View entire presentation