Grab SPAC Presentation Deck
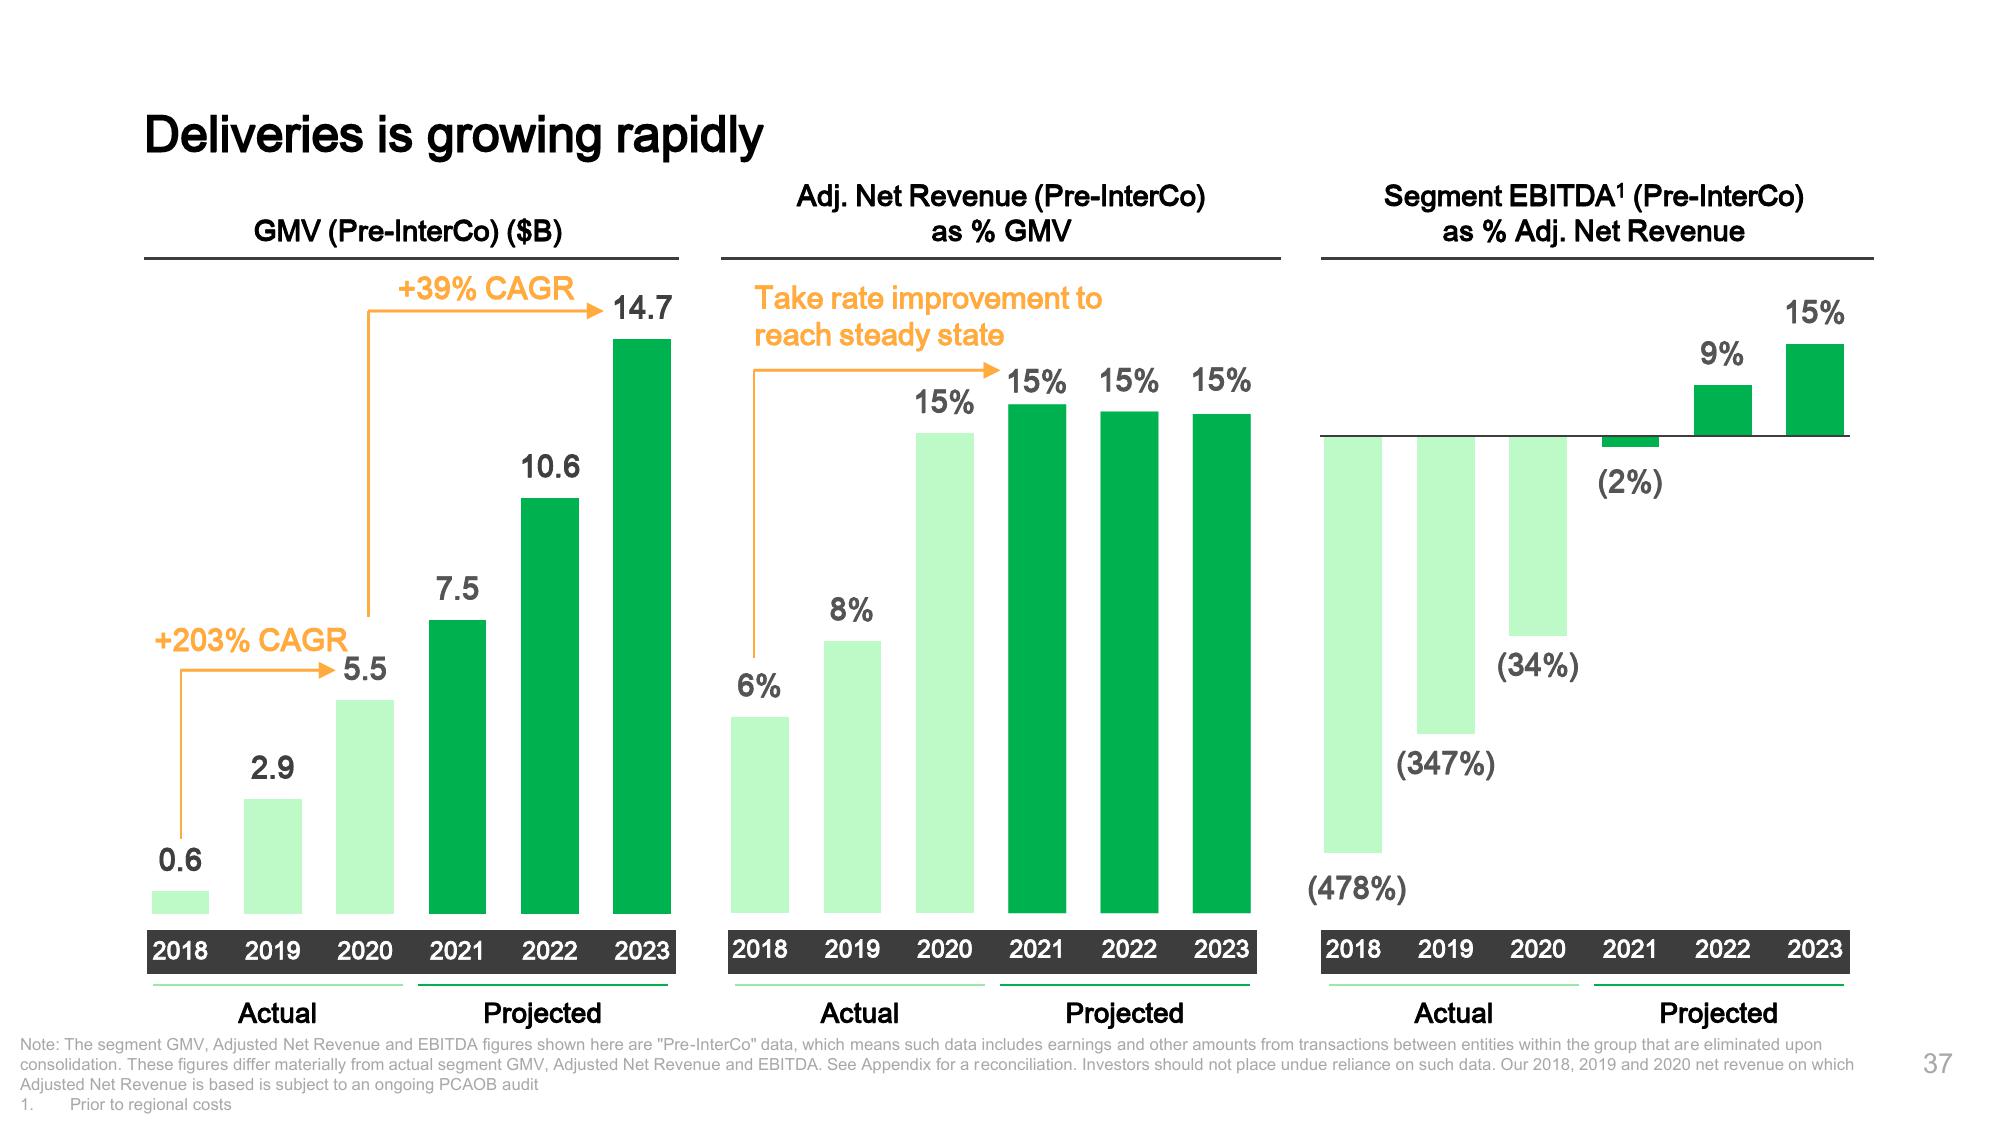
Deliveries is growing rapidly
+203% CAGR
0.6
GMV (Pre-InterCo) ($B)
+39% CAGR
2018
2.9
5.5
7.5
2019 2020 2021
10.6
14.7
2022 2023
Take rate improvement to
reach steady state
15%
6%
Adj. Net Revenue (Pre-InterCo)
as % GMV
2018
8%
2019 2020
15% 15% 15%
2021 2022 2023
Segment EBITDA¹ (Pre-InterCo)
as % Adj. Net Revenue
(347%)
(478%)
2018
(34%)
(2%)
2019 2020 2021
9%
15%
2022 2023
Projected
Actual
Projected
Actual
Projected
Actual
Note: The segment GMV, Adjusted Net Revenue and EBITDA figures shown here are "Pre-InterCo" data, which means such data includes earnings and other amounts from transactions between entities within the group that are eliminated upon
consolidation. These figures differ materially from actual segment GMV, Adjusted Net Revenue and EBITDA. See Appendix for a reconciliation. Investors should not place undue reliance on such data. Our 2018, 2019 and 2020 net revenue on which
Adjusted Net Revenue is based is subject to an ongoing PCAOB audit
1. Prior to regional costs
37View entire presentation