Silicon Valley Bank Results Presentation Deck
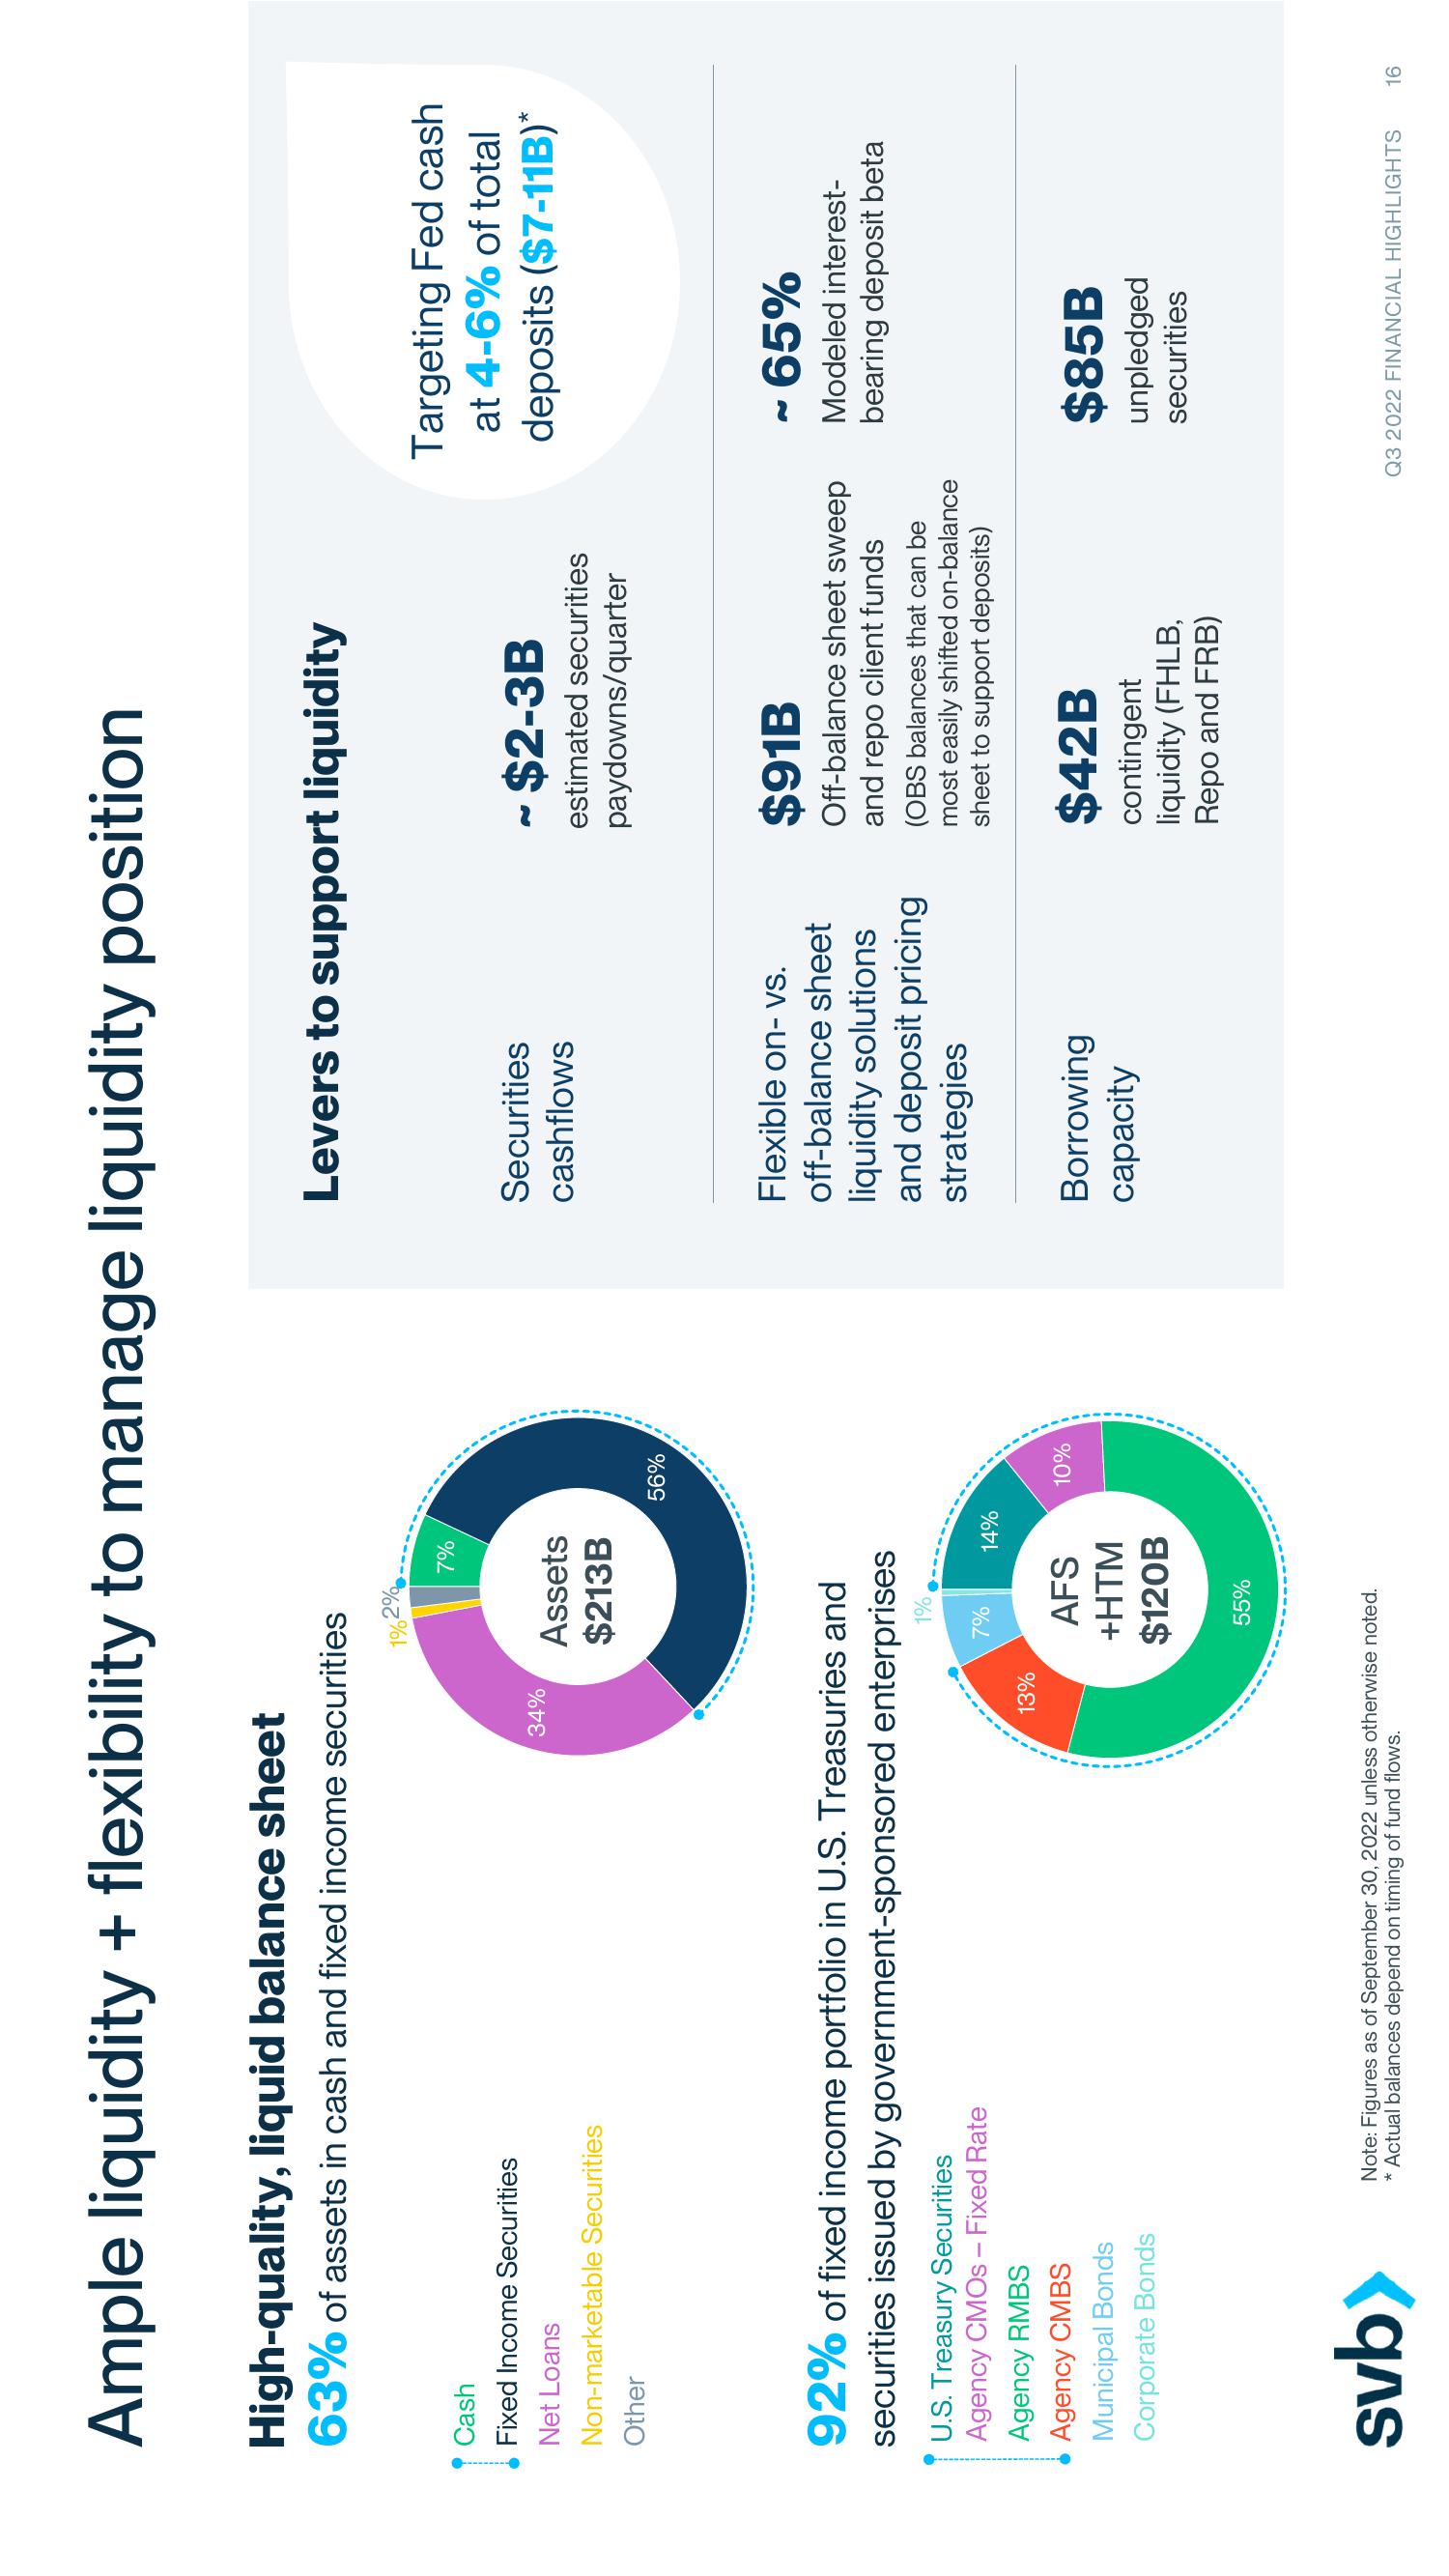
Ample liquidity + flexibility to manage liquidity position
High-quality, liquid balance sheet
63% of assets in cash and fixed income securities
Cash
Fixed Income Securities
Net Loans
Non-marketable Securities
Other
U.S. Treasury Securities
Agency CMOs - Fixed Rate
Agency RMBS
Agency CMBS
Municipal Bonds
Corporate Bonds
34%
svb>
92% of fixed income portfolio in U.S. Treasuries and
securities issued by government-sponsored enterprises
1%
1% 2%
13%
Assets
$213B
7%
7%
55%
AFS
+HTM
$120B
Note: Figures as of September 30, 2022 unless otherwise noted.
* Actual balances depend on timing of fund flows.
14%
56%
10%
Levers to support liquidity
Securities
cashflows
Flexible on- vs.
off-balance sheet
liquidity solutions
and deposit pricing
strategies
Borrowing
capacity
N
~ $2-3B
estimated securities
paydowns/quarter
$91B
Off-balance sheet sweep
and repo client funds
(OBS balances that can be
most easily shifted on-balance
sheet to support deposits)
$42B
contingent
liquidity (FHLB,
Repo and FRB)
Targeting Fed cash
at 4-6% of total
deposits ($7-11B)*
~ 65%
Modeled interest-
bearing deposit beta
$85B
unpledged
securities
Q3 2022 FINANCIAL HIGHLIGHTS 16View entire presentation