Modeling with New Disclosures Linking Price & Drivers to Financial Results
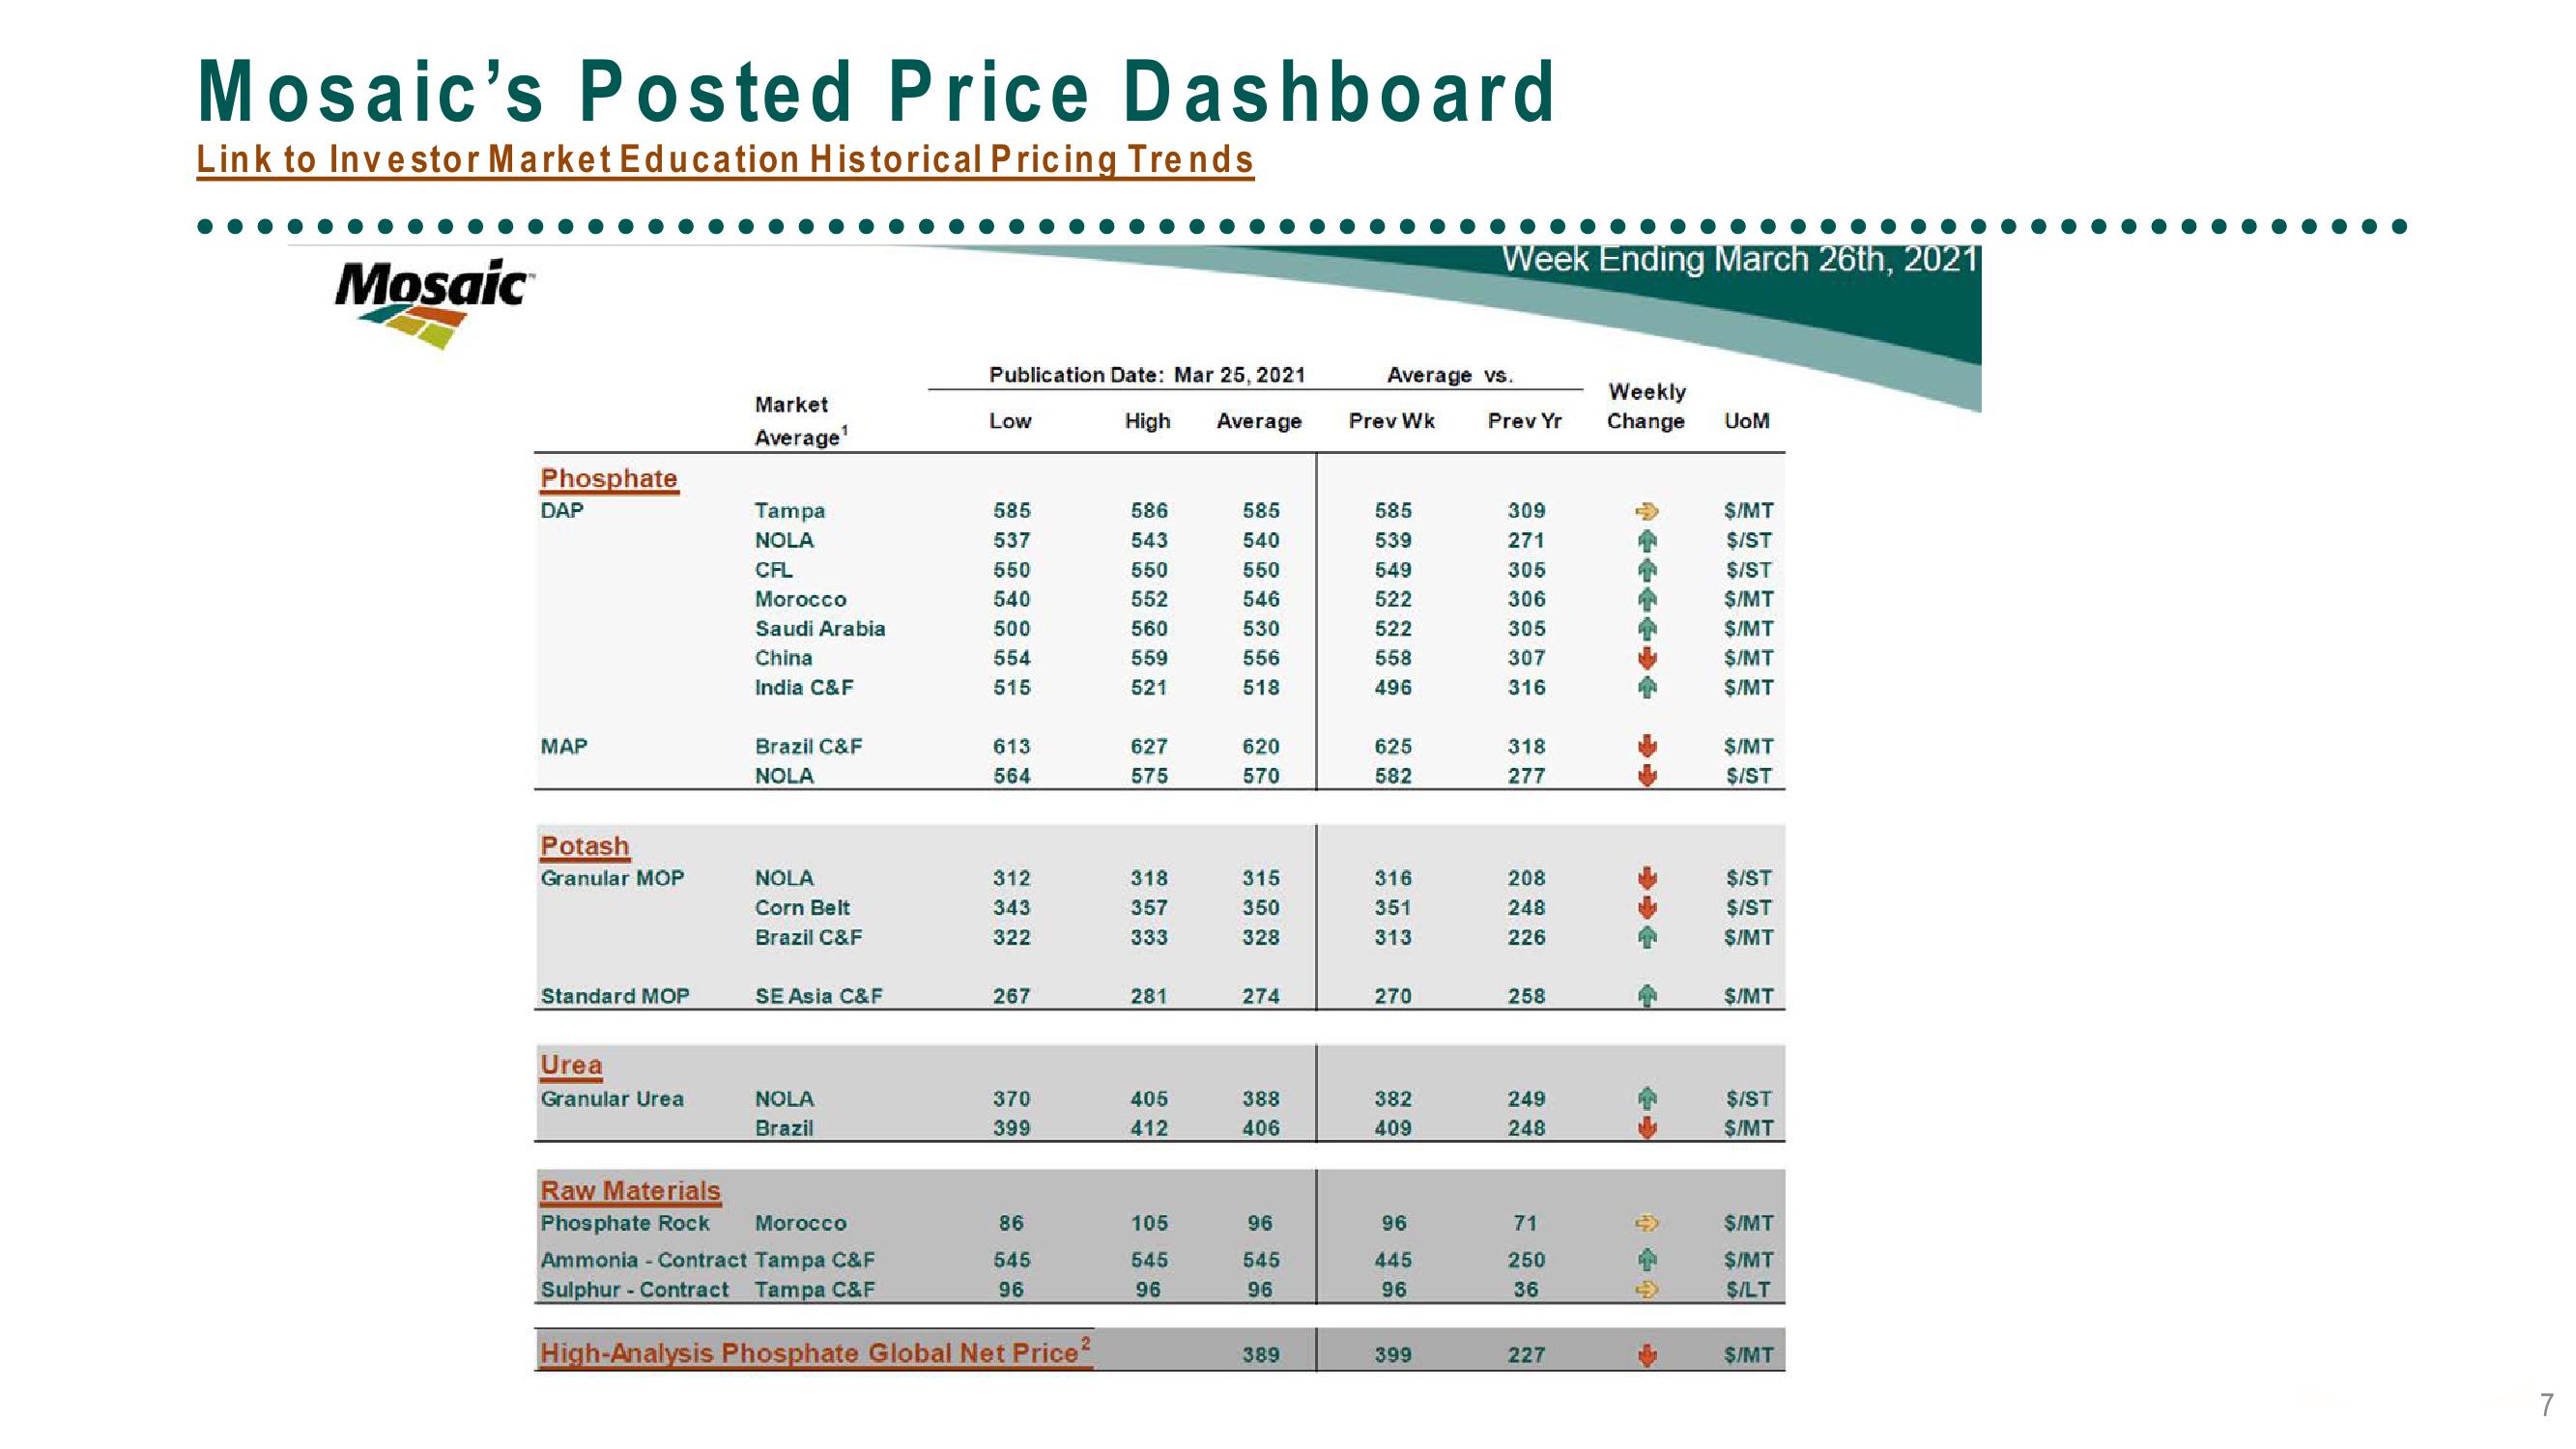
Mosaic's Posted Price Dashboard
Link to Investor Market Education Historical Pricing Trends
Mosaic
Phosphate
DAP
MAP
Potash
Granular MOP
Standard MOP
Urea
Granular Urea
Market
Average ¹
Tampa
NOLA
CFL
Morocco
Saudi Arabia
China
India C&F
Brazil C&F
NOLA
NOLA
Corn Belt
Brazil C&F
SE Asia C&F
NOLA
Brazil
Publication Date: Mar 25, 2021
High Average
Low
585
537
550
540
500
554
515
613
564
312
343
322
267
370
399
Raw Materials
Phosphate Rock
Morocco
Ammonia - Contract Tampa C&F
Sulphur - Contract Tampa C&F
High-Analysis Phosphate Global Net Price²
86
545
96
586
543
550
552
560
559
521
627
575
318
357
333
281
405
412
105
545
96
585
540
550
546
530
556
518
620
570
315
350
328
274
388
406
96
545
96
389
Average vs.
Prev Wk
585
539
549
522
522
558
496
625
582
316
351
313
270
382
409
96
445
96
Week Ending March 26th, 2021
399
Prev Yr
309
271
305
306
305
307
316
318
277
208
248
226
258
249
248
71
250
36
227
Weekly
Change
UOM
$/MT
$/ST
$/ST
$/MT
$/MT
$/MT
$/MT
$/MT
$/ST
$/ST
$/ST
$/MT
$/MT
$/ST
$/MT
$/MT
$/MT
S/LT
$/MT
7View entire presentation