Maersk Results Presentation Deck
A.P. Moller Maersk Group
- Interim Report 02 2015
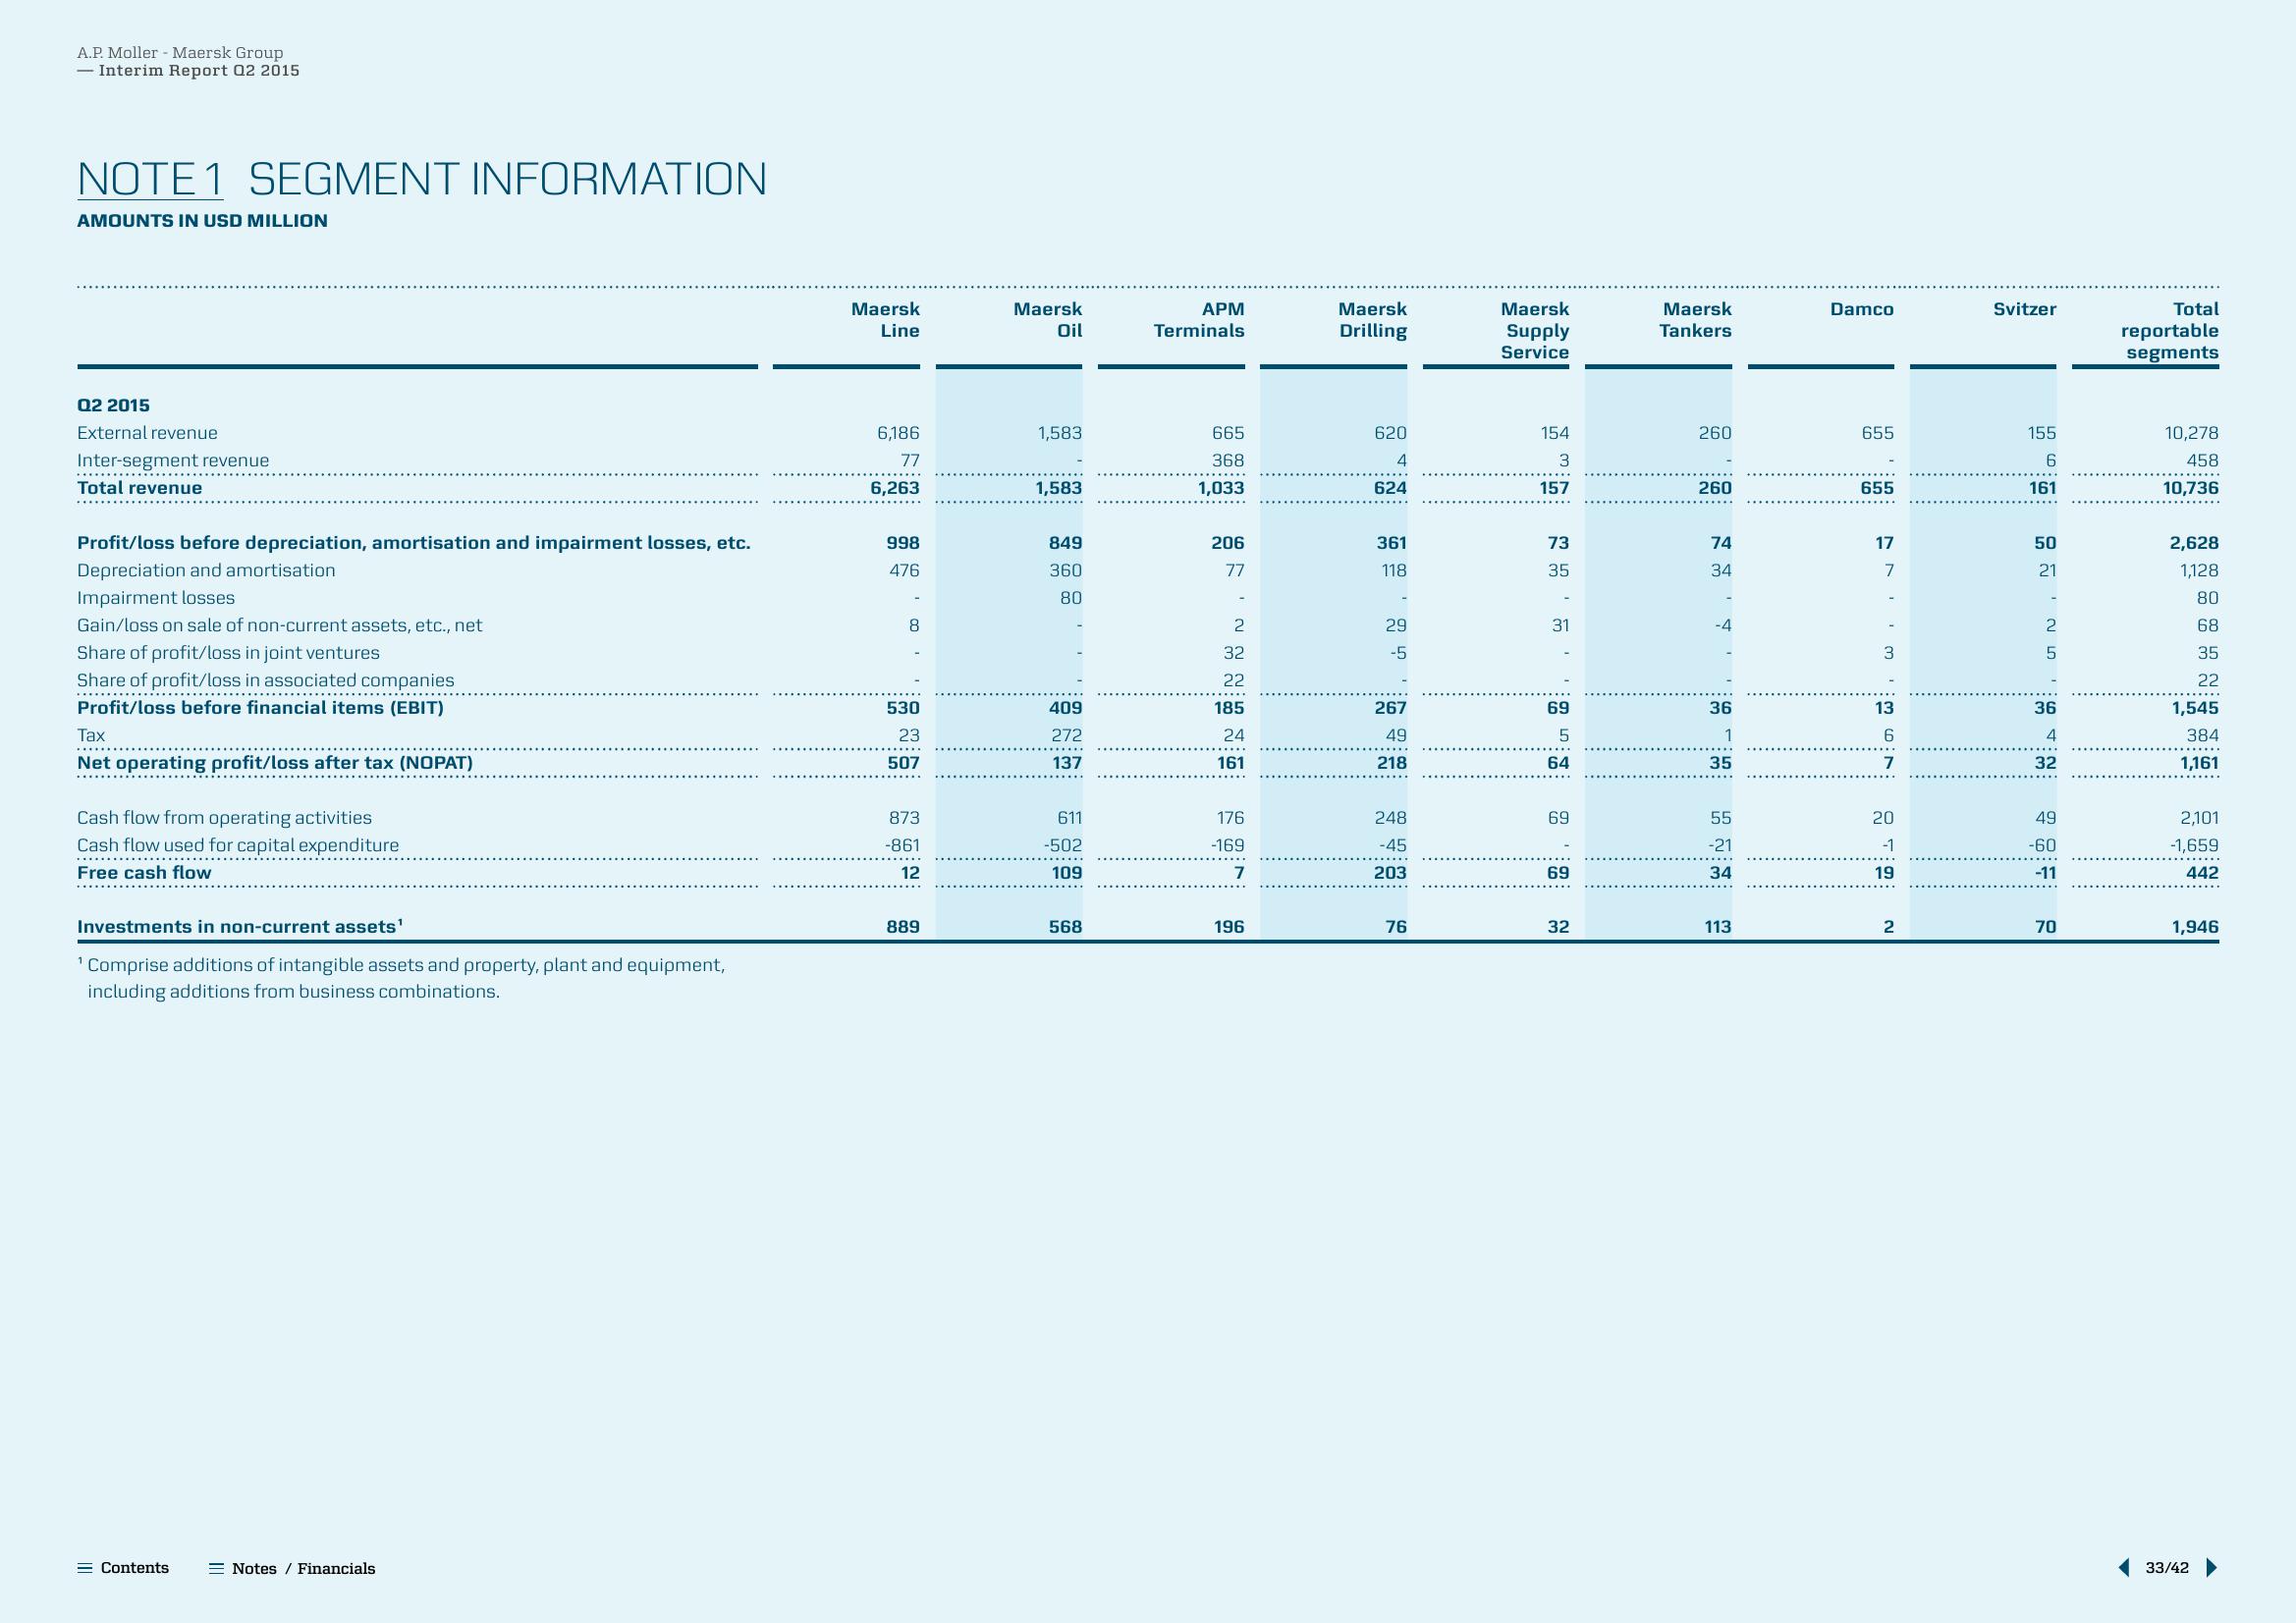
NOTE 1 SEGMENT INFORMATION
AMOUNTS IN USD MILLION
Q2 2015
External revenue
Inter-segment revenue
Total revenue
Profit/loss before depreciation, amortisation and impairment losses, etc.
Depreciation and amortisation
Impairment losses
Gain/loss on sale of non-current assets, etc., net
Share of profit/loss in joint ventures
Share of profit/loss in associated companies
Profit/loss before financial items (EBIT)
**********………….…...
Tax
Net operating profit/loss after tax (NOPAT)
Cash flow from operating activities
Cash flow used for capital expenditure
Free cash flow
Investments in non-current assets¹
¹ Comprise additions of intangible assets and property, plant and equipment,
including additions from business combinations.
= Contents
Notes / Financials
Maersk
Line
6,186
77
6,263
998
476
8
530
23
507
873
-861
12
889
Maersk
Oil
1,583
1,583
849
360
80
409
272
137
611
-502
109
568
APM
Terminals
665
368
1,033
206
77
2
32
22
185
24
161
176
-169
7
196
Maersk
Drilling
620
4
624
361
118
29
-5
267
49
218
248
-45
203
76
Maersk
Supply
Service
154
3
157
73
35
31
69
5
64
69
69
32
Maersk
Tankers
260
260
74
34
-
-4
36
35
55
-21
34
113
Damco
655
655
17
7
3
36:7
13
20
-1
19
2
Svitzer
155
161
50
21
-
2
5
36
4
32
49
-60
-11
70
Total
reportable
segments
10,278
458
10,736
2,628
1,128
80
68
35
22
1,545
384
1,161
2,101
-1,659
442
1,946
33/42View entire presentation