Goldman Sachs Investment Banking Pitch Book
Goldman
Sachs
US M&A Market Update
$1,059
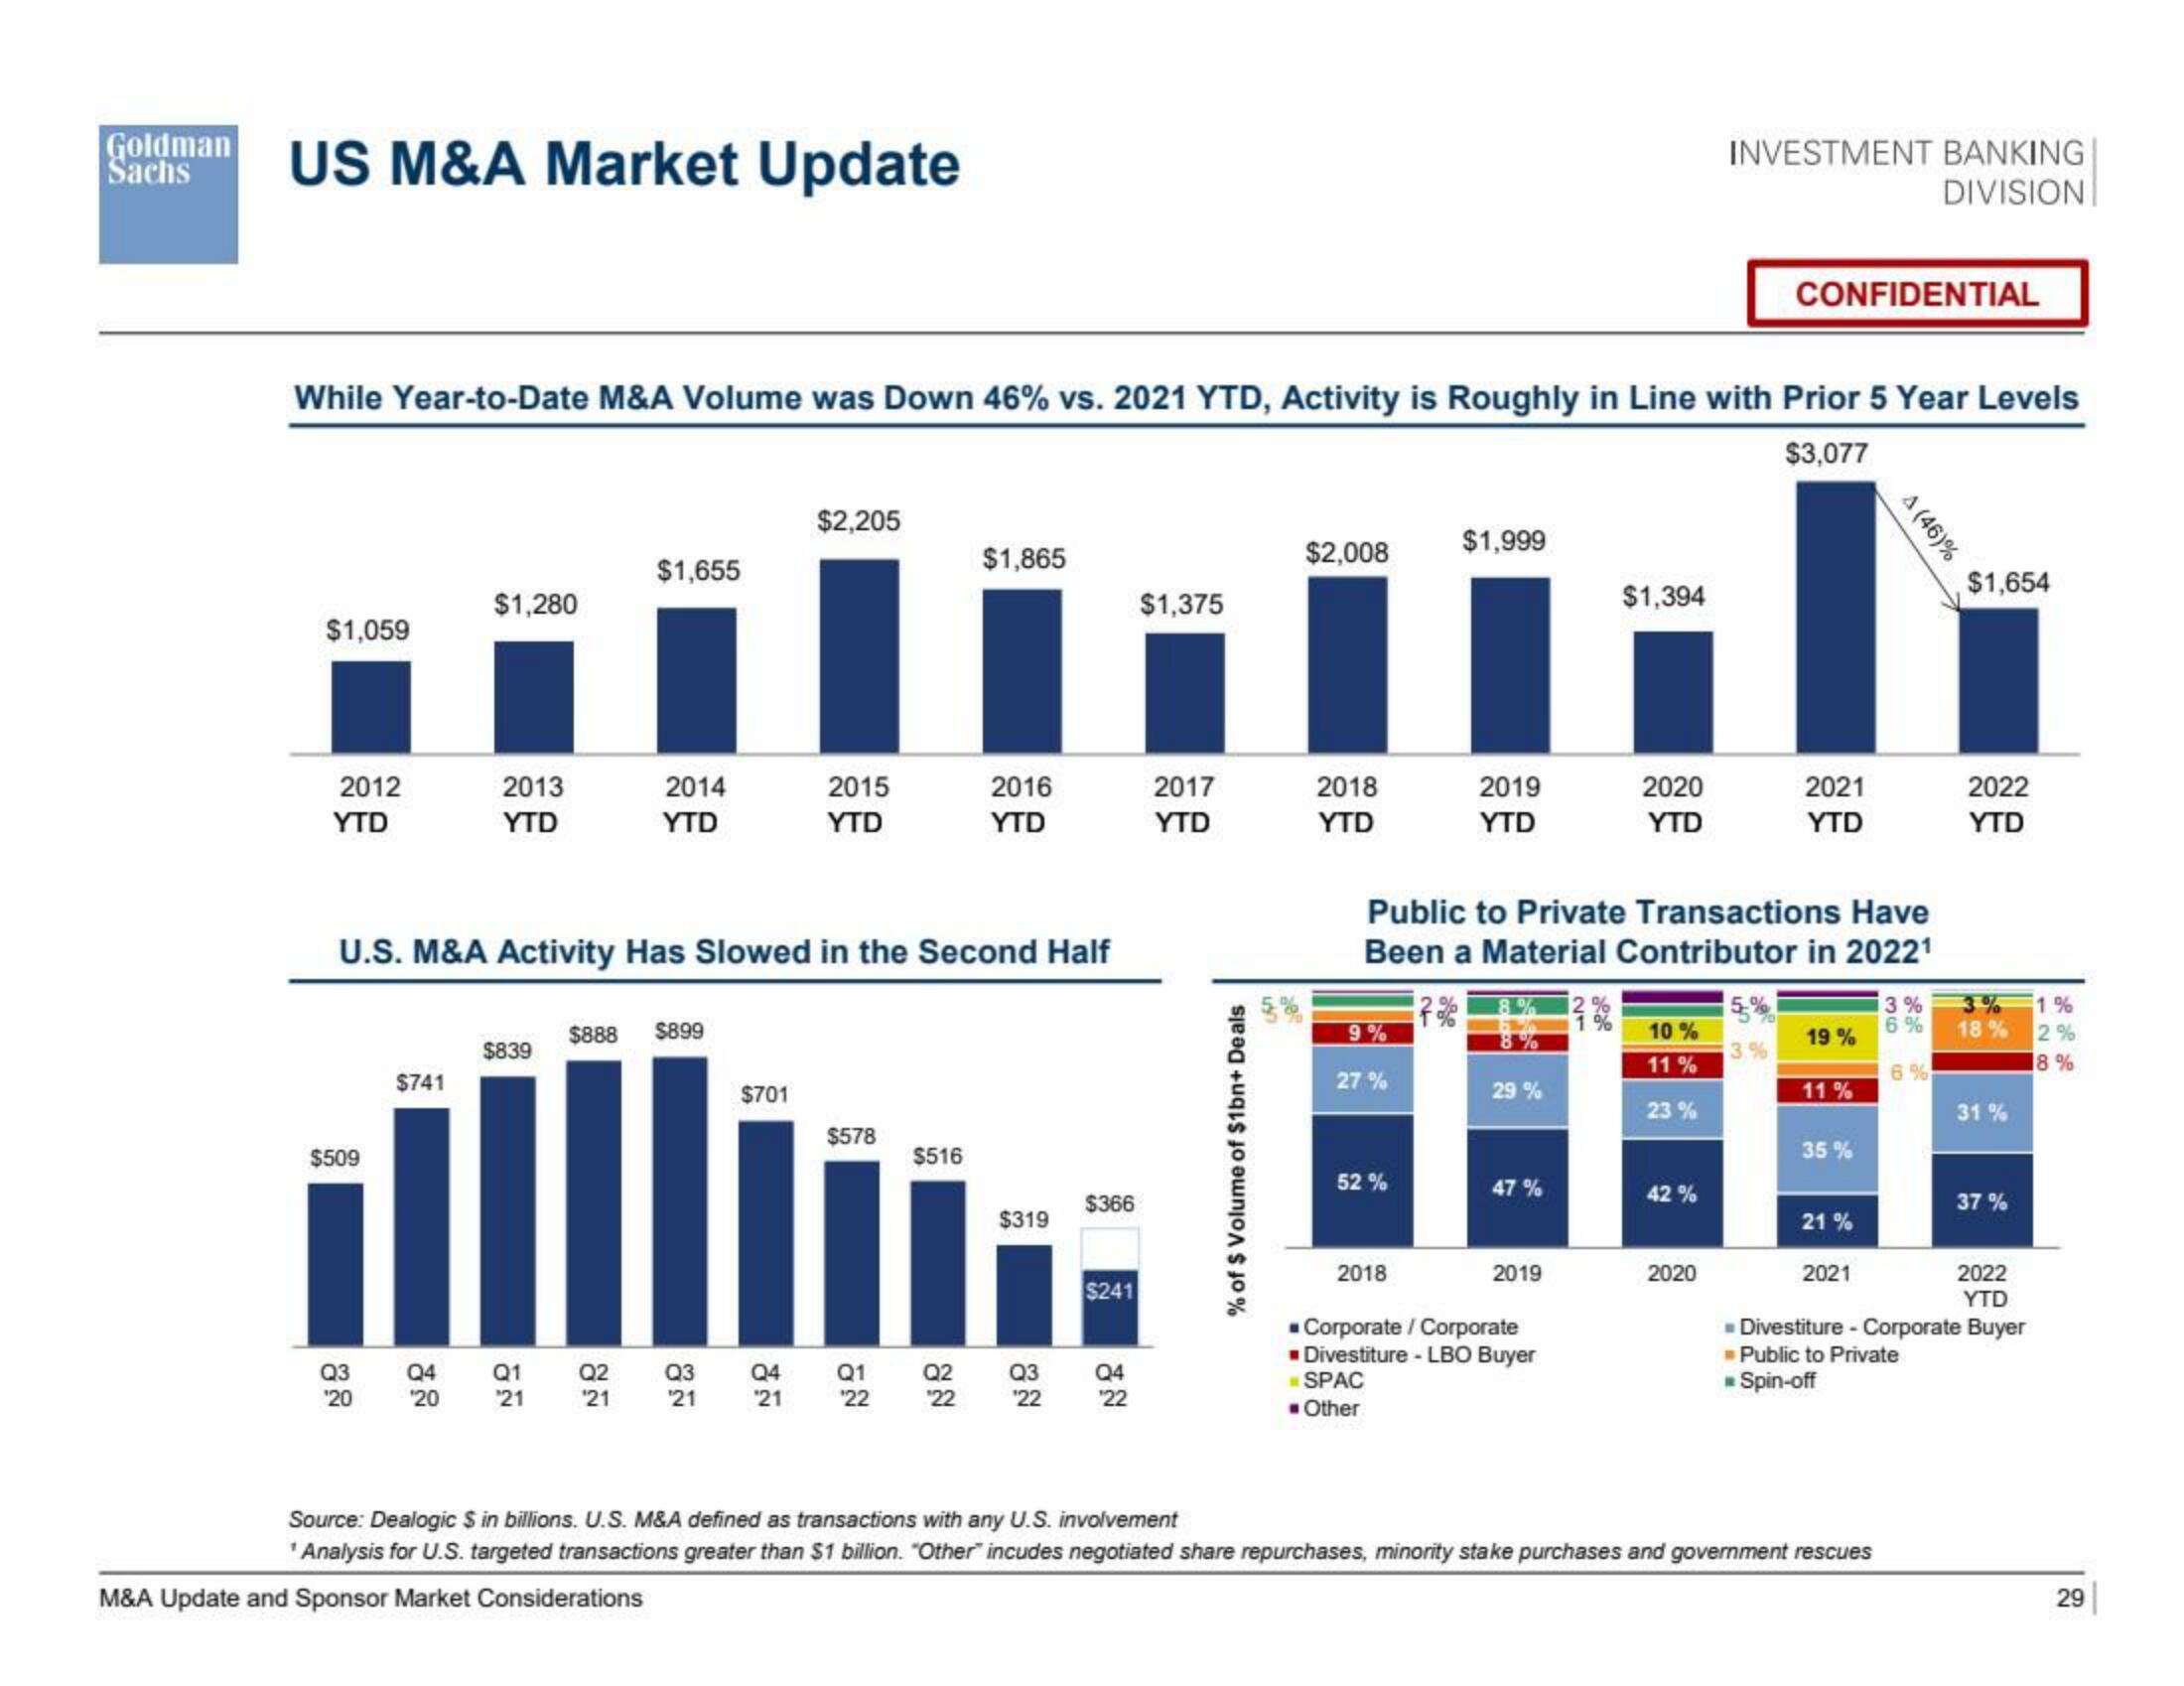
While Year-to-Date M&A Volume was Down 46% vs. 2021 YTD, Activity is Roughly in Line with Prior 5 Year Levels
$3,077
2012
YTD
$509
$741
$1,280
Q3
Q4
¹20 ¹20
2013
YTD
$839
Q1
U.S. M&A Activity Has Slowed in the Second Half
21
$1,655
2014
YTD
Q2
'21
$888 $899
$701
$2,205
Q3
Q4
21 ¹21
2015
YTD
$578
Q1
¹22
$516
$1,865
Q2
¹22
2016
YTD
$319
Q3
¹22
$366
$241
| ៩ន
Q4
$1,375
2017
YTD
% of $ Volume of $1bn+ Deals
$2,008
2018
YTD
%
27%
52%
$1,999
2018
2019
YTD
8%
Public to Private Transactions Have
Been a Material Contributor in 2022¹
7%
29%
47%
2019
$1,394
■ Corporate / Corporate
■ Divestiture - LBO Buyer
☐ SPAC
■ Other
2020
YTD
10%
11%
23%
INVESTMENT BANKING
DIVISION
42 %
2020
CONFIDENTIAL
5%
3%
2021
YTD
19%
11%
35%
21%
2021
A (46)%
Source: Dealogic $ in billions. U.S. M&A defined as transactions with any U.S. involvement
'Analysis for U.S. targeted transactions greater than $1 billion. "Other" incudes negotiated share repurchases, minority stake purchases and government rescues
M&A Update and Sponsor Market Considerations
%
6%
6%
$1,654
2022
YTD
18%
31%
37%
2022
YTD
%
2%
18%
Divestiture - Corporate Buyer
> Public to Private
RR Spin-off
29View entire presentation