Snap Inc Results Presentation Deck
Net Loss
Leverage³
Net Loss & Adjusted EBITDA¹
(dollars in millions, unaudited)
NET LOSS
Q1'20
(66)%
$(306)
3%
Net Loss Margin
Q2'20
(72)%
$(326)
(107)%
Q3'20
(29)%
$(200)
12%
Q4'20
(12)%
$(113)
36%
Q1'21
(37)%
$(287)
6%
Q2'21
(15)%
$(152)
33%
Adjusted
EBITDA
Leverage4
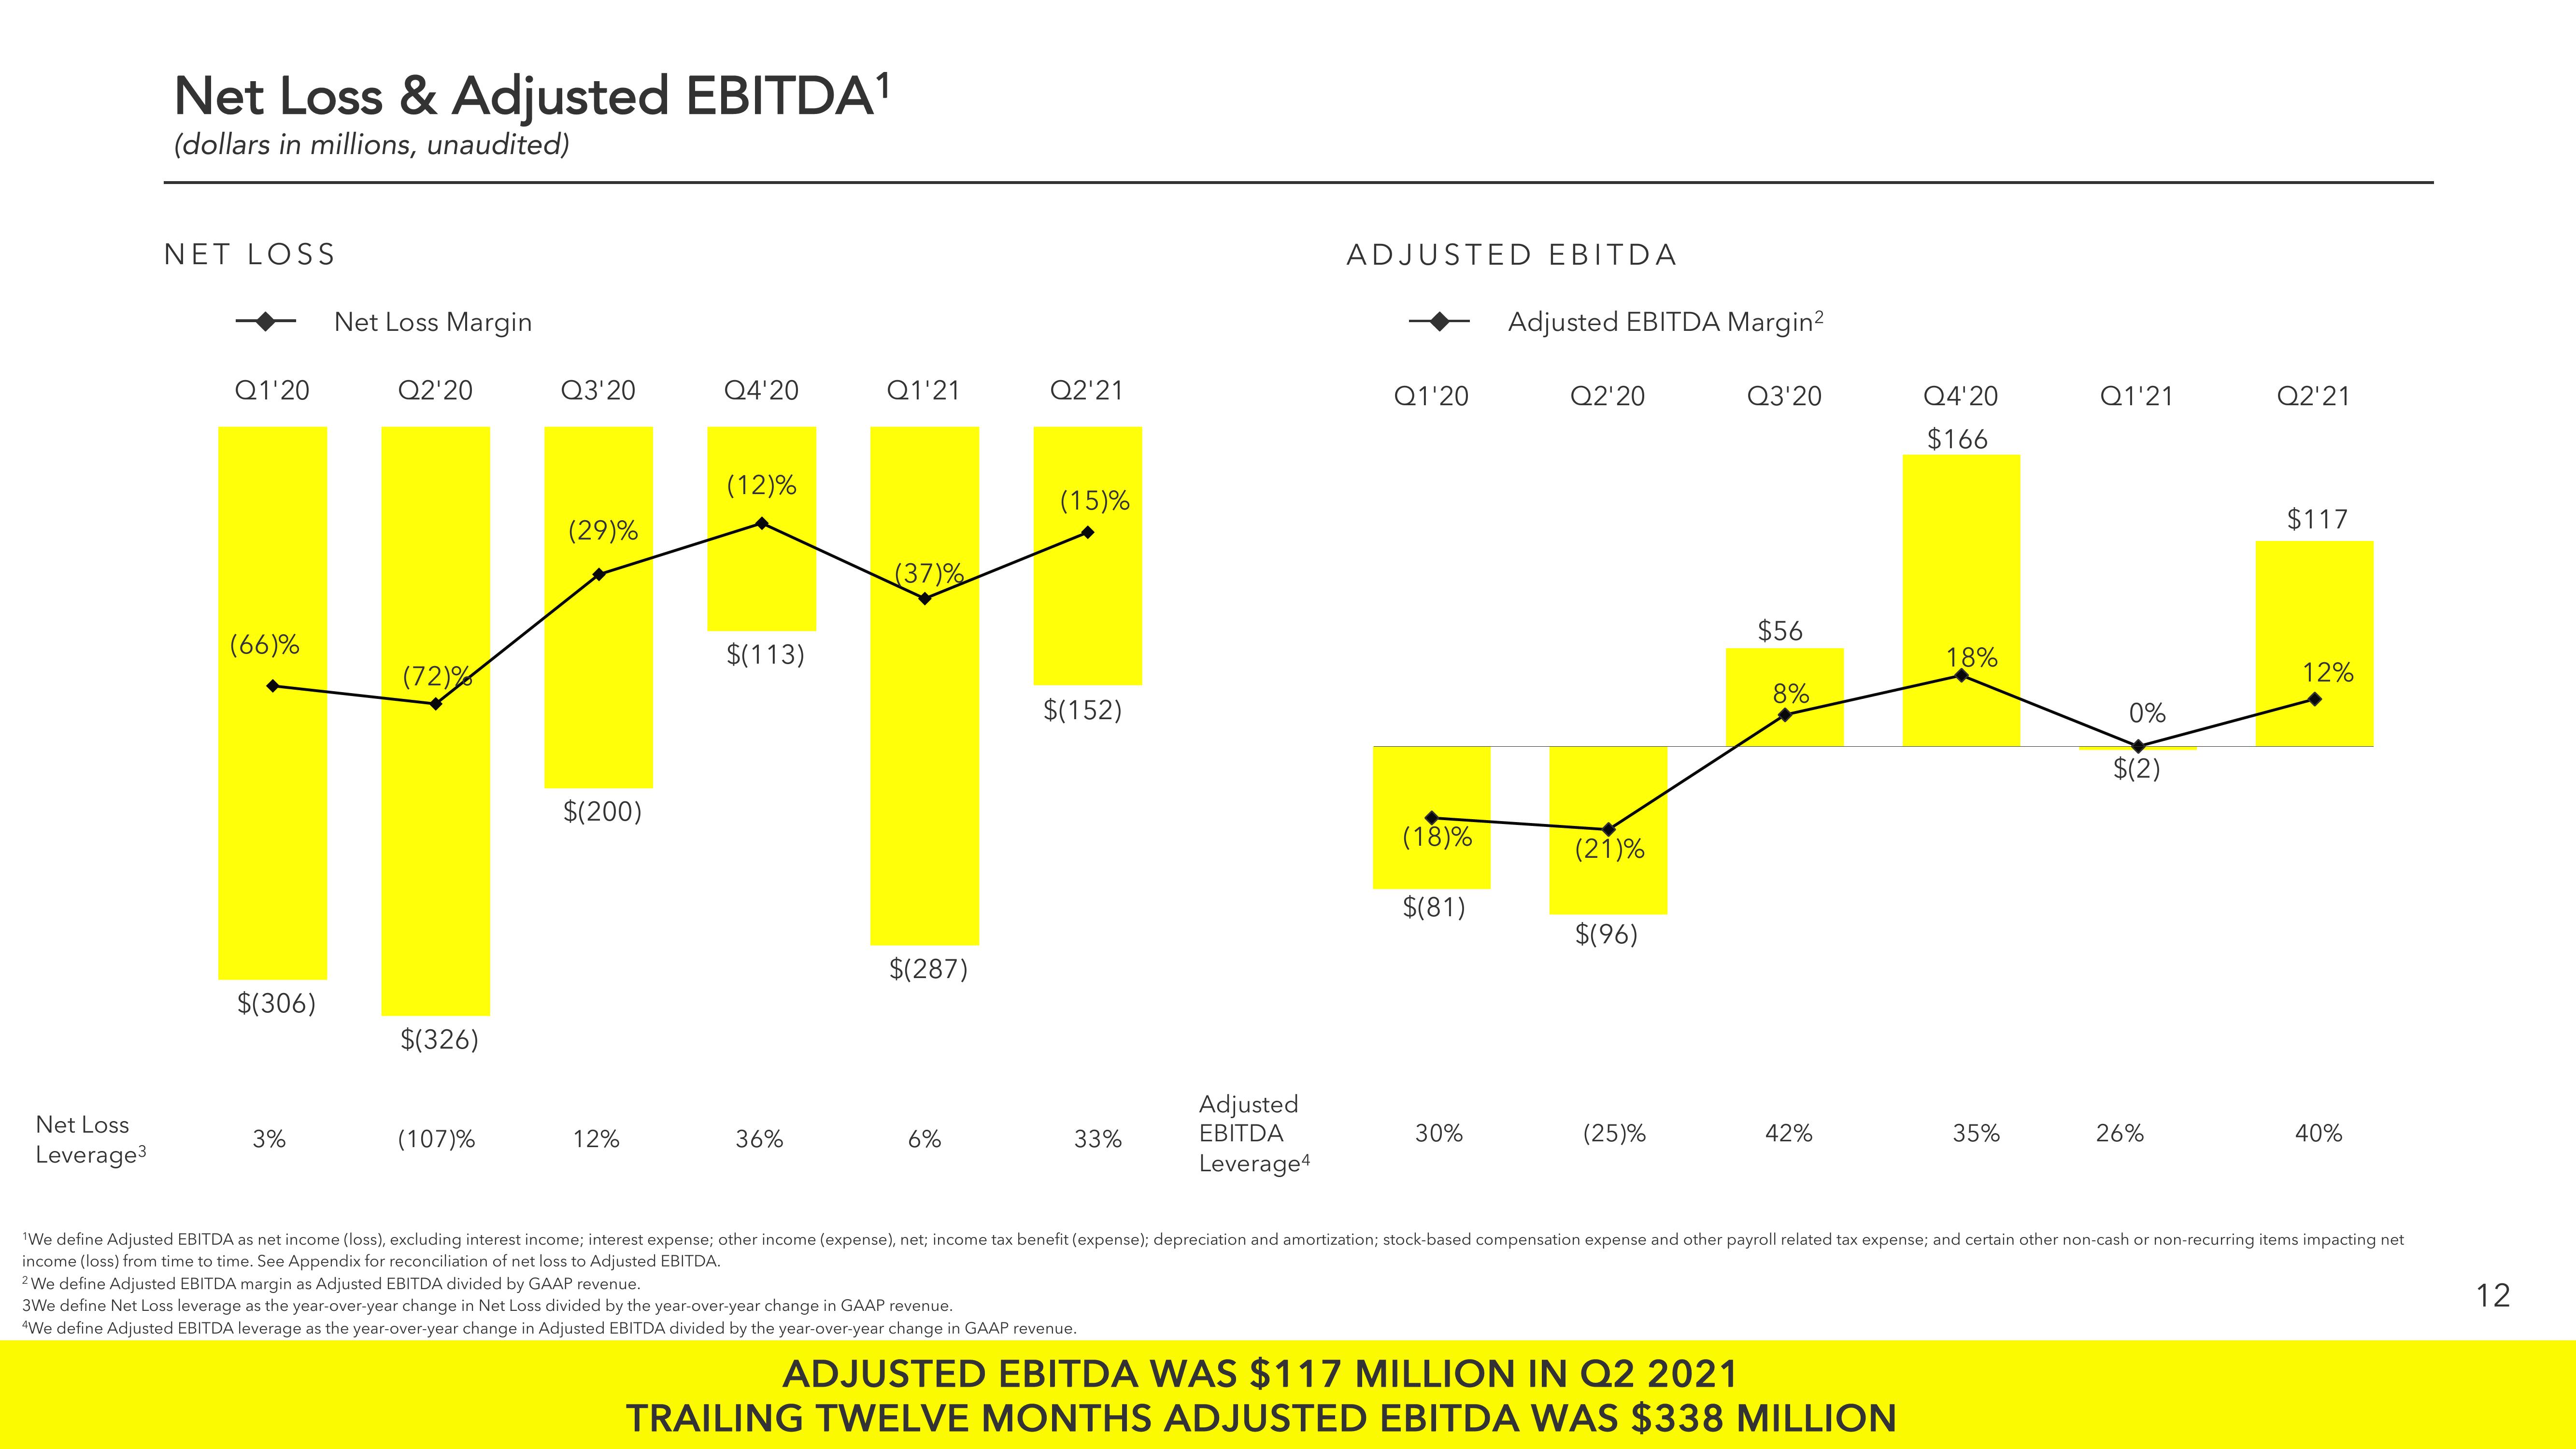
2 We define Adjusted EBITDA margin as Adjusted EBITDA divided by GAAP revenue.
3We define Net Loss leverage as the year-over-year change in Net Loss divided by the year-over-year change in GAAP revenue.
"We define Adjusted EBITDA leverage as the year-over-year change in Adjusted EBITDA divided by the year-over-year change in GAAP revenue.
ADJUSTED EBITDA
Q1'20
(18)%
$(81)
30%
Adjusted EBITDA Margin²
Q2'20
(21)%
$(96)
(25)%
Q3'20
$56
8%
42%
Q4'20
$166
ADJUSTED EBITDA WAS $117 MILLION IN Q2 2021
TRAILING TWELVE MONTHS ADJUSTED EBITDA WAS $338 MILLION
18%
35%
Q1'21
0%
$(2)
26%
Q2'21
$117
12%
'We define Adjusted EBITDA as net income (loss), excluding interest income; interest expense; other income (expense), net; income tax benefit (expense); depreciation and amortization; stock-based compensation expense and other payroll related tax expense; and certain other non-cash or non-recurring items impacting net
income (loss) from time to time. See Appendix for reconciliation of net loss to Adjusted EBITDA.
40%
12View entire presentation