Bird Investor Presentation Deck
Significant progress in profitability roadmap in Q3
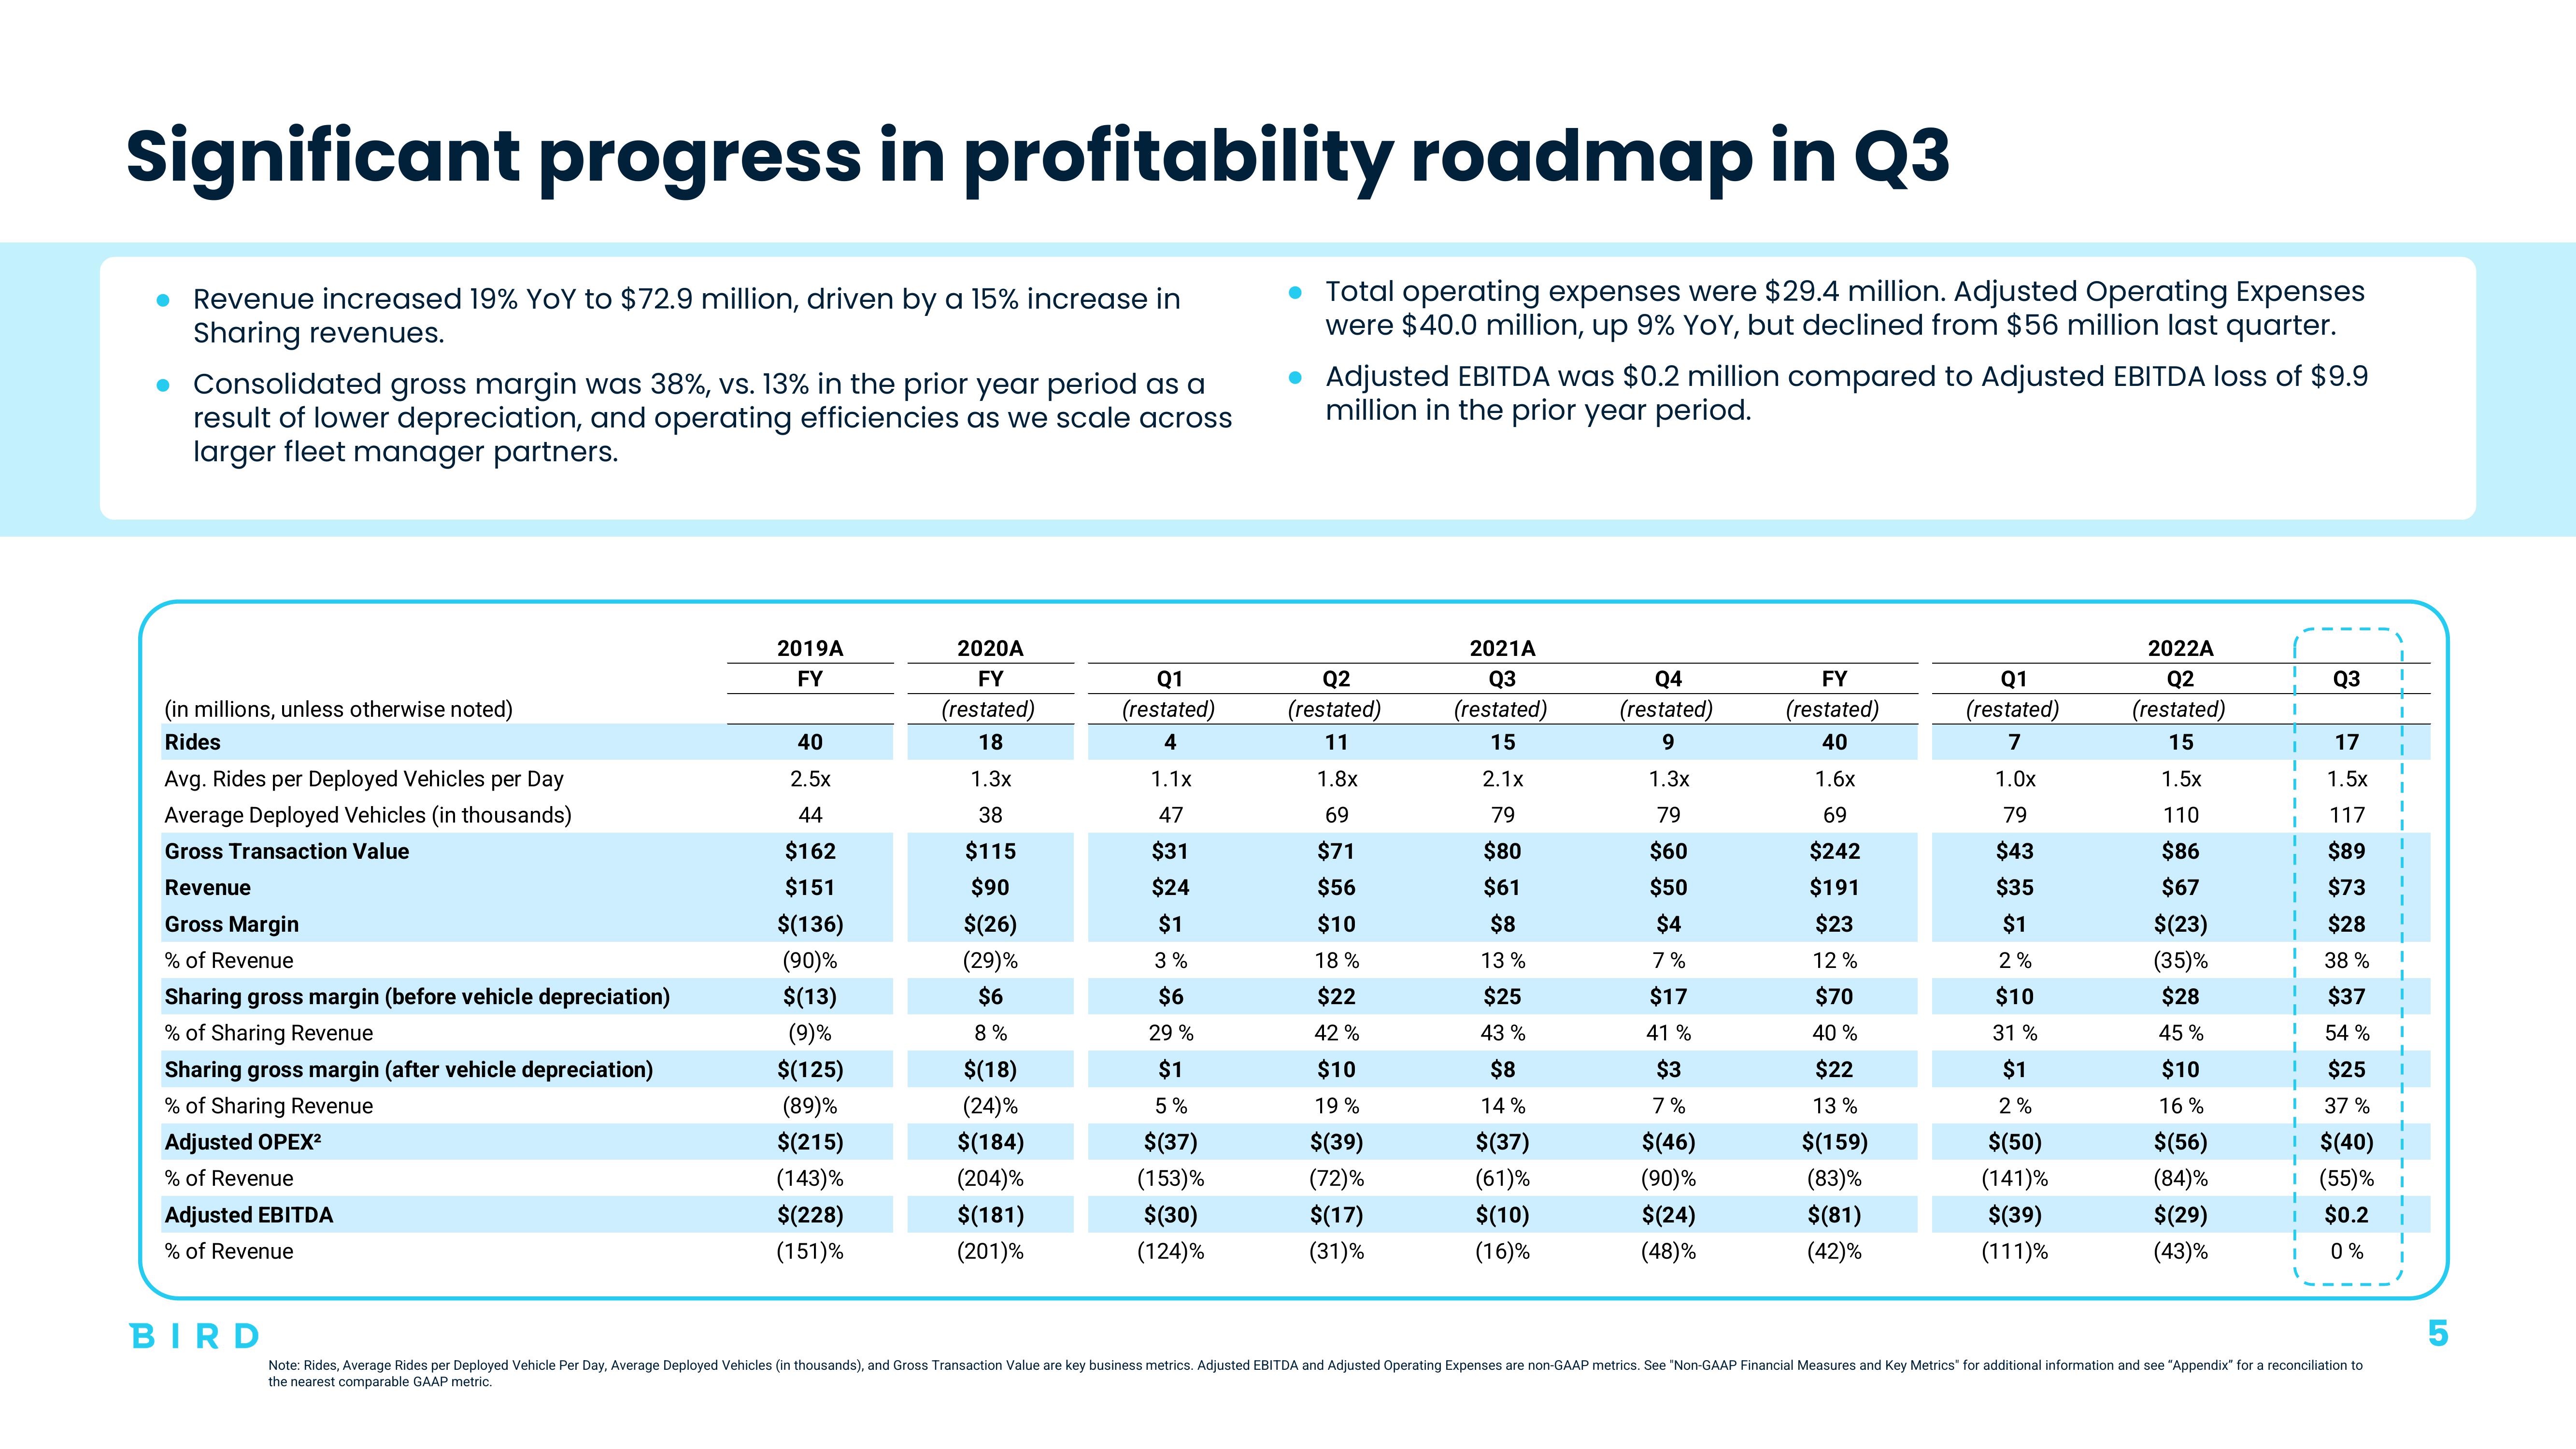
● Revenue increased 19% YoY to $72.9 million, driven by a 15% increase in
Sharing revenues.
• Consolidated gross margin was 38%, vs. 13% in the prior year period as a
result of lower depreciation, and operating efficiencies as we scale across
larger fleet manager partners.
(in millions, unless otherwise noted)
Rides
Avg. Rides per Deployed Vehicles per Day
Average Deployed Vehicles (in thousands)
Gross Transaction Value
Revenue
Gross Margin
% of Revenue
Sharing gross margin (before vehicle depreciation)
% of Sharing Revenue
Sharing gross margin (after vehicle depreciation)
% of Sharing Revenue
Adjusted OPEX²
% of Revenue
Adjusted EBITDA
% of Revenue
BIRD
2019A
FY
40
2.5x
44
$162
$151
$(136)
(90)%
$(13)
(9)%
$(125)
(89)%
$(215)
(143)%
$(228)
(151)%
2020A
FY
(restated)
18
1.3x
38
$115
$90
$(26)
(29)%
$6
8%
$(18)
(24)%
$(184)
(204)%
$(181)
(201)%
Q1
(restated)
4
1.1x
47
$31
$24
$1
3%
$6
29 %
$1
5%
$(37)
(153)%
$(30)
(124)%
●
●
Total operating expenses were $29.4 million. Adjusted Operating Expenses
were $40.0 million, up 9% YOY, but declined from $56 million last quarter.
Adjusted EBITDA was $0.2 million compared to Adjusted EBITDA loss of $9.9
million in the prior year period.
Q2
(restated)
11
1.8x
69
$71
$56
$10
18%
$22
42 %
$10
19%
$(39)
(72)%
$(17)
(31)%
2021A
Q3
(restated)
15
2.1x
79
$80
$61
$8
13 %
$25
43%
$8
14%
$(37)
(61)%
$(10)
(16)%
Q4
(restated)
9
1.3x
79
$60
$50
$4
7%
$17
41%
$3
7%
$(46)
(90)%
$(24)
(48)%
FY
(restated)
40
1.6x
69
$242
$191
$23
12%
$70
40 %
$22
13%
$(159)
(83)%
$(81)
(42)%
Q1
(restated)
7
1.0x
79
$43
$35
$1
2%
$10
31%
$1
2%
$(50)
(141)%
$(39)
(111)%
2022A
Q2
(restated)
15
1.5x
110
$86
$67
$(23)
(35)%
$28
45%
$10
16%
$(56)
(84)%
$(29)
(43)%
Q3
17
1.5x
117
$89
$73
$28
38 %
$37
54%
I
$25
I 37%
$(40)
(55)%
$0.2
0%
I
Note: Rides, Average Rides per Deployed Vehicle Per Day, Average Deployed Vehicles (in thousands), and Gross Transaction Value are key business metrics. Adjusted EBITDA and Adjusted Operating Expenses are non-GAAP metrics. See "Non-GAAP Financial Measures and Key Metrics for additional information and see "Appendix" for a reconciliation to
the nearest comparable GAAP metric.
L
5View entire presentation