Shopify Investor Presentation Deck
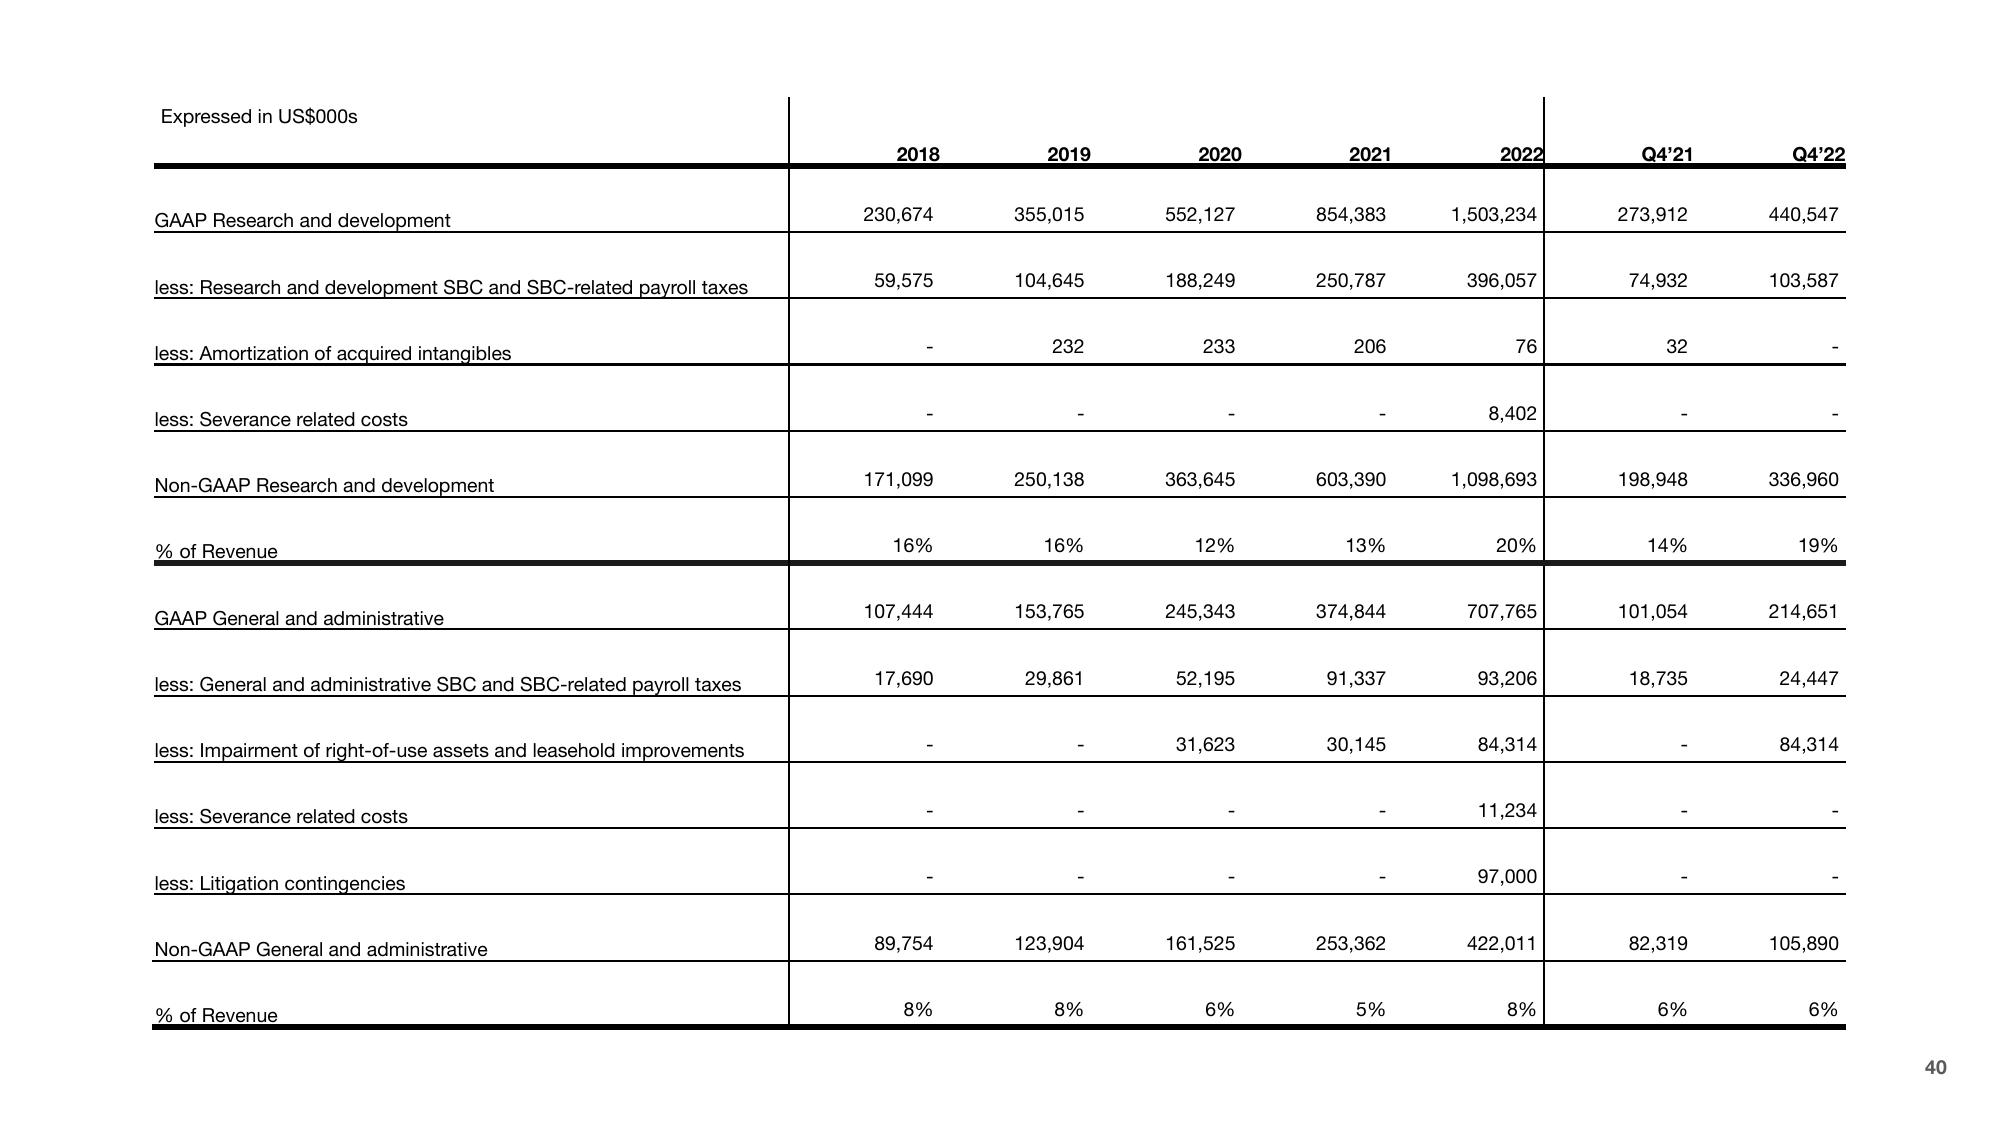
Expressed in US$000s
GAAP Research and development
less: Research and development SBC and SBC-related payroll taxes
less: Amortization of acquired intangibles
less: Severance related costs
Non-GAAP Research and development
% of Revenue
GAAP General and administrative
less: General and administrative SBC and SBC-related payroll taxes
less: Impairment of right-of-use assets and leasehold improvements
less: Severance related costs
less: Litigation contingencies
Non-GAAP General and administrative
% of Revenue
2018
230,674
59,575
171,099
16%
107,444
17,690
89,754
8%
2019
355,015
104,645
232
250,138
16%
153,765
29,861
123,904
8%
2020
552,127
188,249
233
363,645
12%
245,343
52,195
31,623
161,525
6%
2021
854,383
250,787
206
603,390
13%
374,844
91,337
30,145
253,362
5%
2022
1,503,234
396,057
76
8,402
1,098,693
20%
707,765
93,206
84,314
11,234
97,000
422,011
8%
Q4'21
273,912
74,932
32
198,948
14%
101,054
18,735
82,319
6%
Q4'22
440,547
103,587
336,960
19%
214,651
24,447
84,314
105,890
6%
40View entire presentation