OmniAb Results Presentation Deck
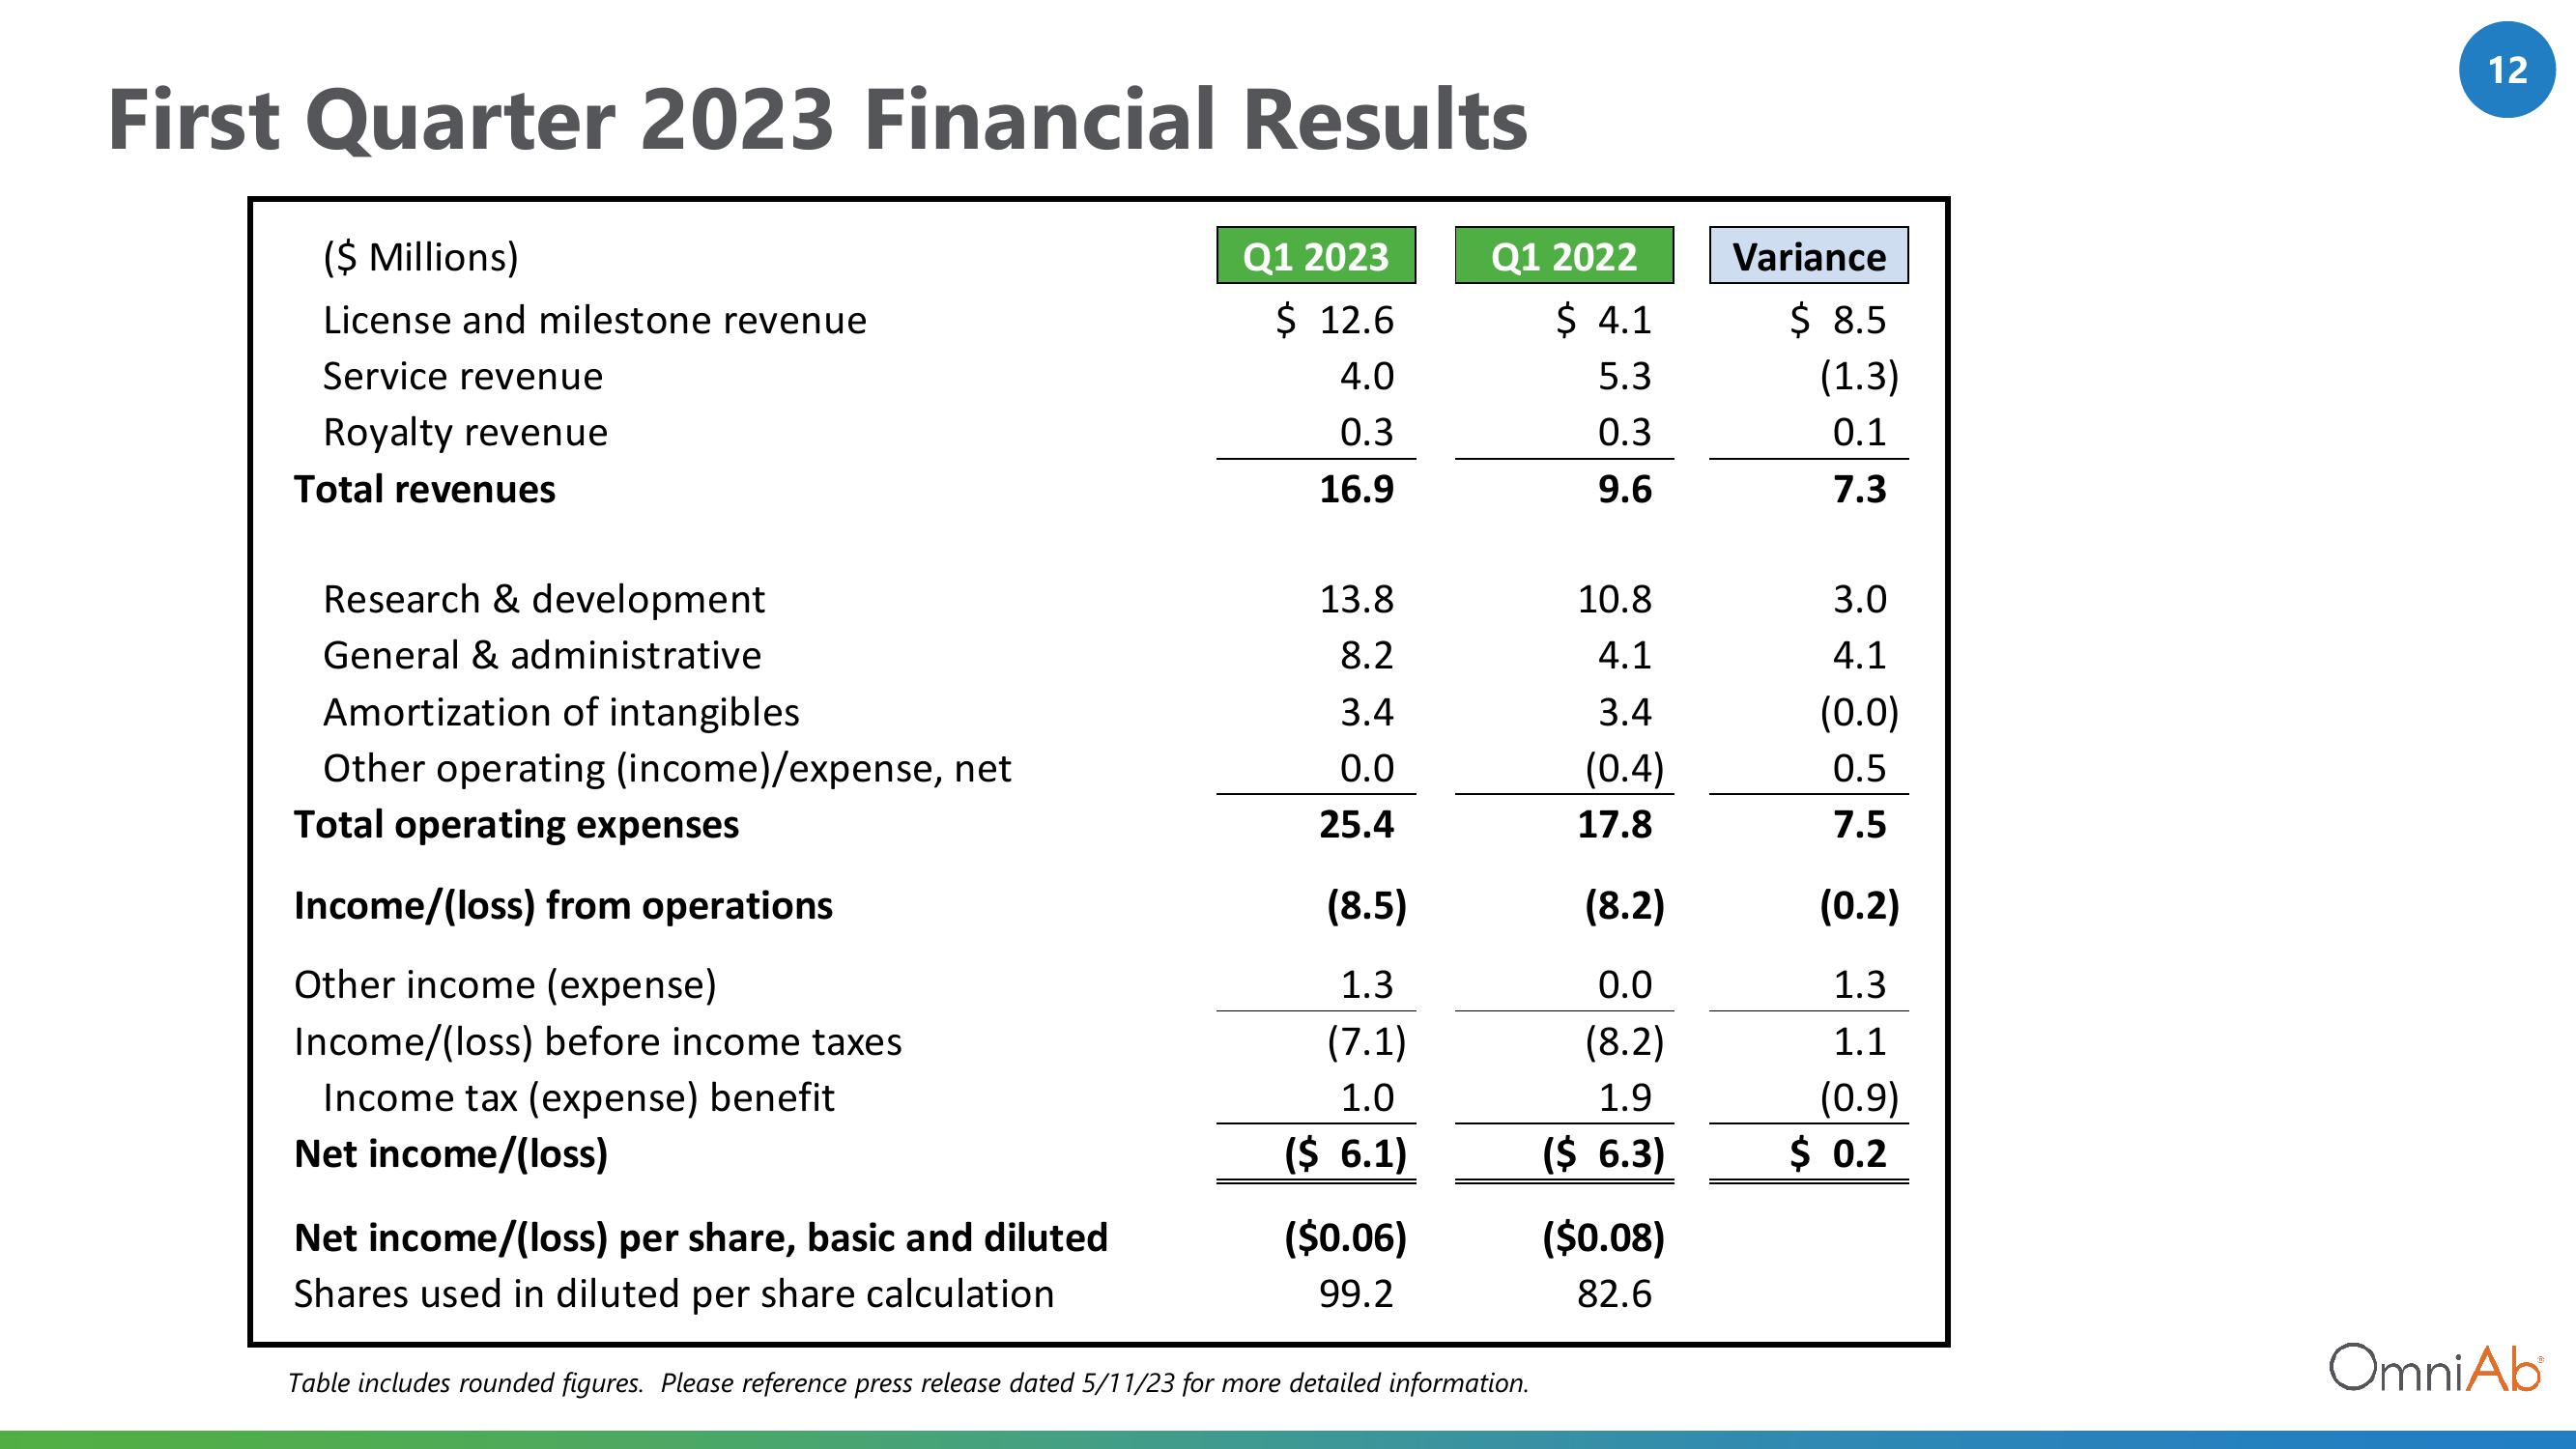
First Quarter 2023 Financial Results
Q1 2023
$ 12.6
4.0
0.3
16.9
($ Millions)
License and milestone revenue
Service revenue
Royalty revenue
Total revenues
Research & development
General & administrative
Amortization of intangibles
Other operating (income)/expense, net
Total operating expenses
Income/(loss) from operations
Other income (expense)
Income/(loss) before income taxes
Income tax (expense) benefit
Net income/(loss)
Net income/(loss) per share, basic and diluted
Shares used in diluted per share calculation
13.8
8.2
3.4
0.0
25.4
(8.5)
1.3
(7.1)
1.0
($ 6.1)
($0.06)
99.2
Q1 2022
Table includes rounded figures. Please reference press release dated 5/11/23 for more detailed information.
$ 4.1
5.3
0.3
9.6
10.8
4.1
3.4
(0.4)
17.8
(8.2)
0.0
(8.2)
1.9
($ 6.3)
($0.08)
82.6
Variance
$ 8.5
(1.3)
0.1
7.3
3.0
4.1
(0.0)
0.5
7.5
(0.2)
1.3
1.1
(0.9)
$ 0.2
12
OmniAbView entire presentation