Bed Bath & Beyond Results Presentation Deck
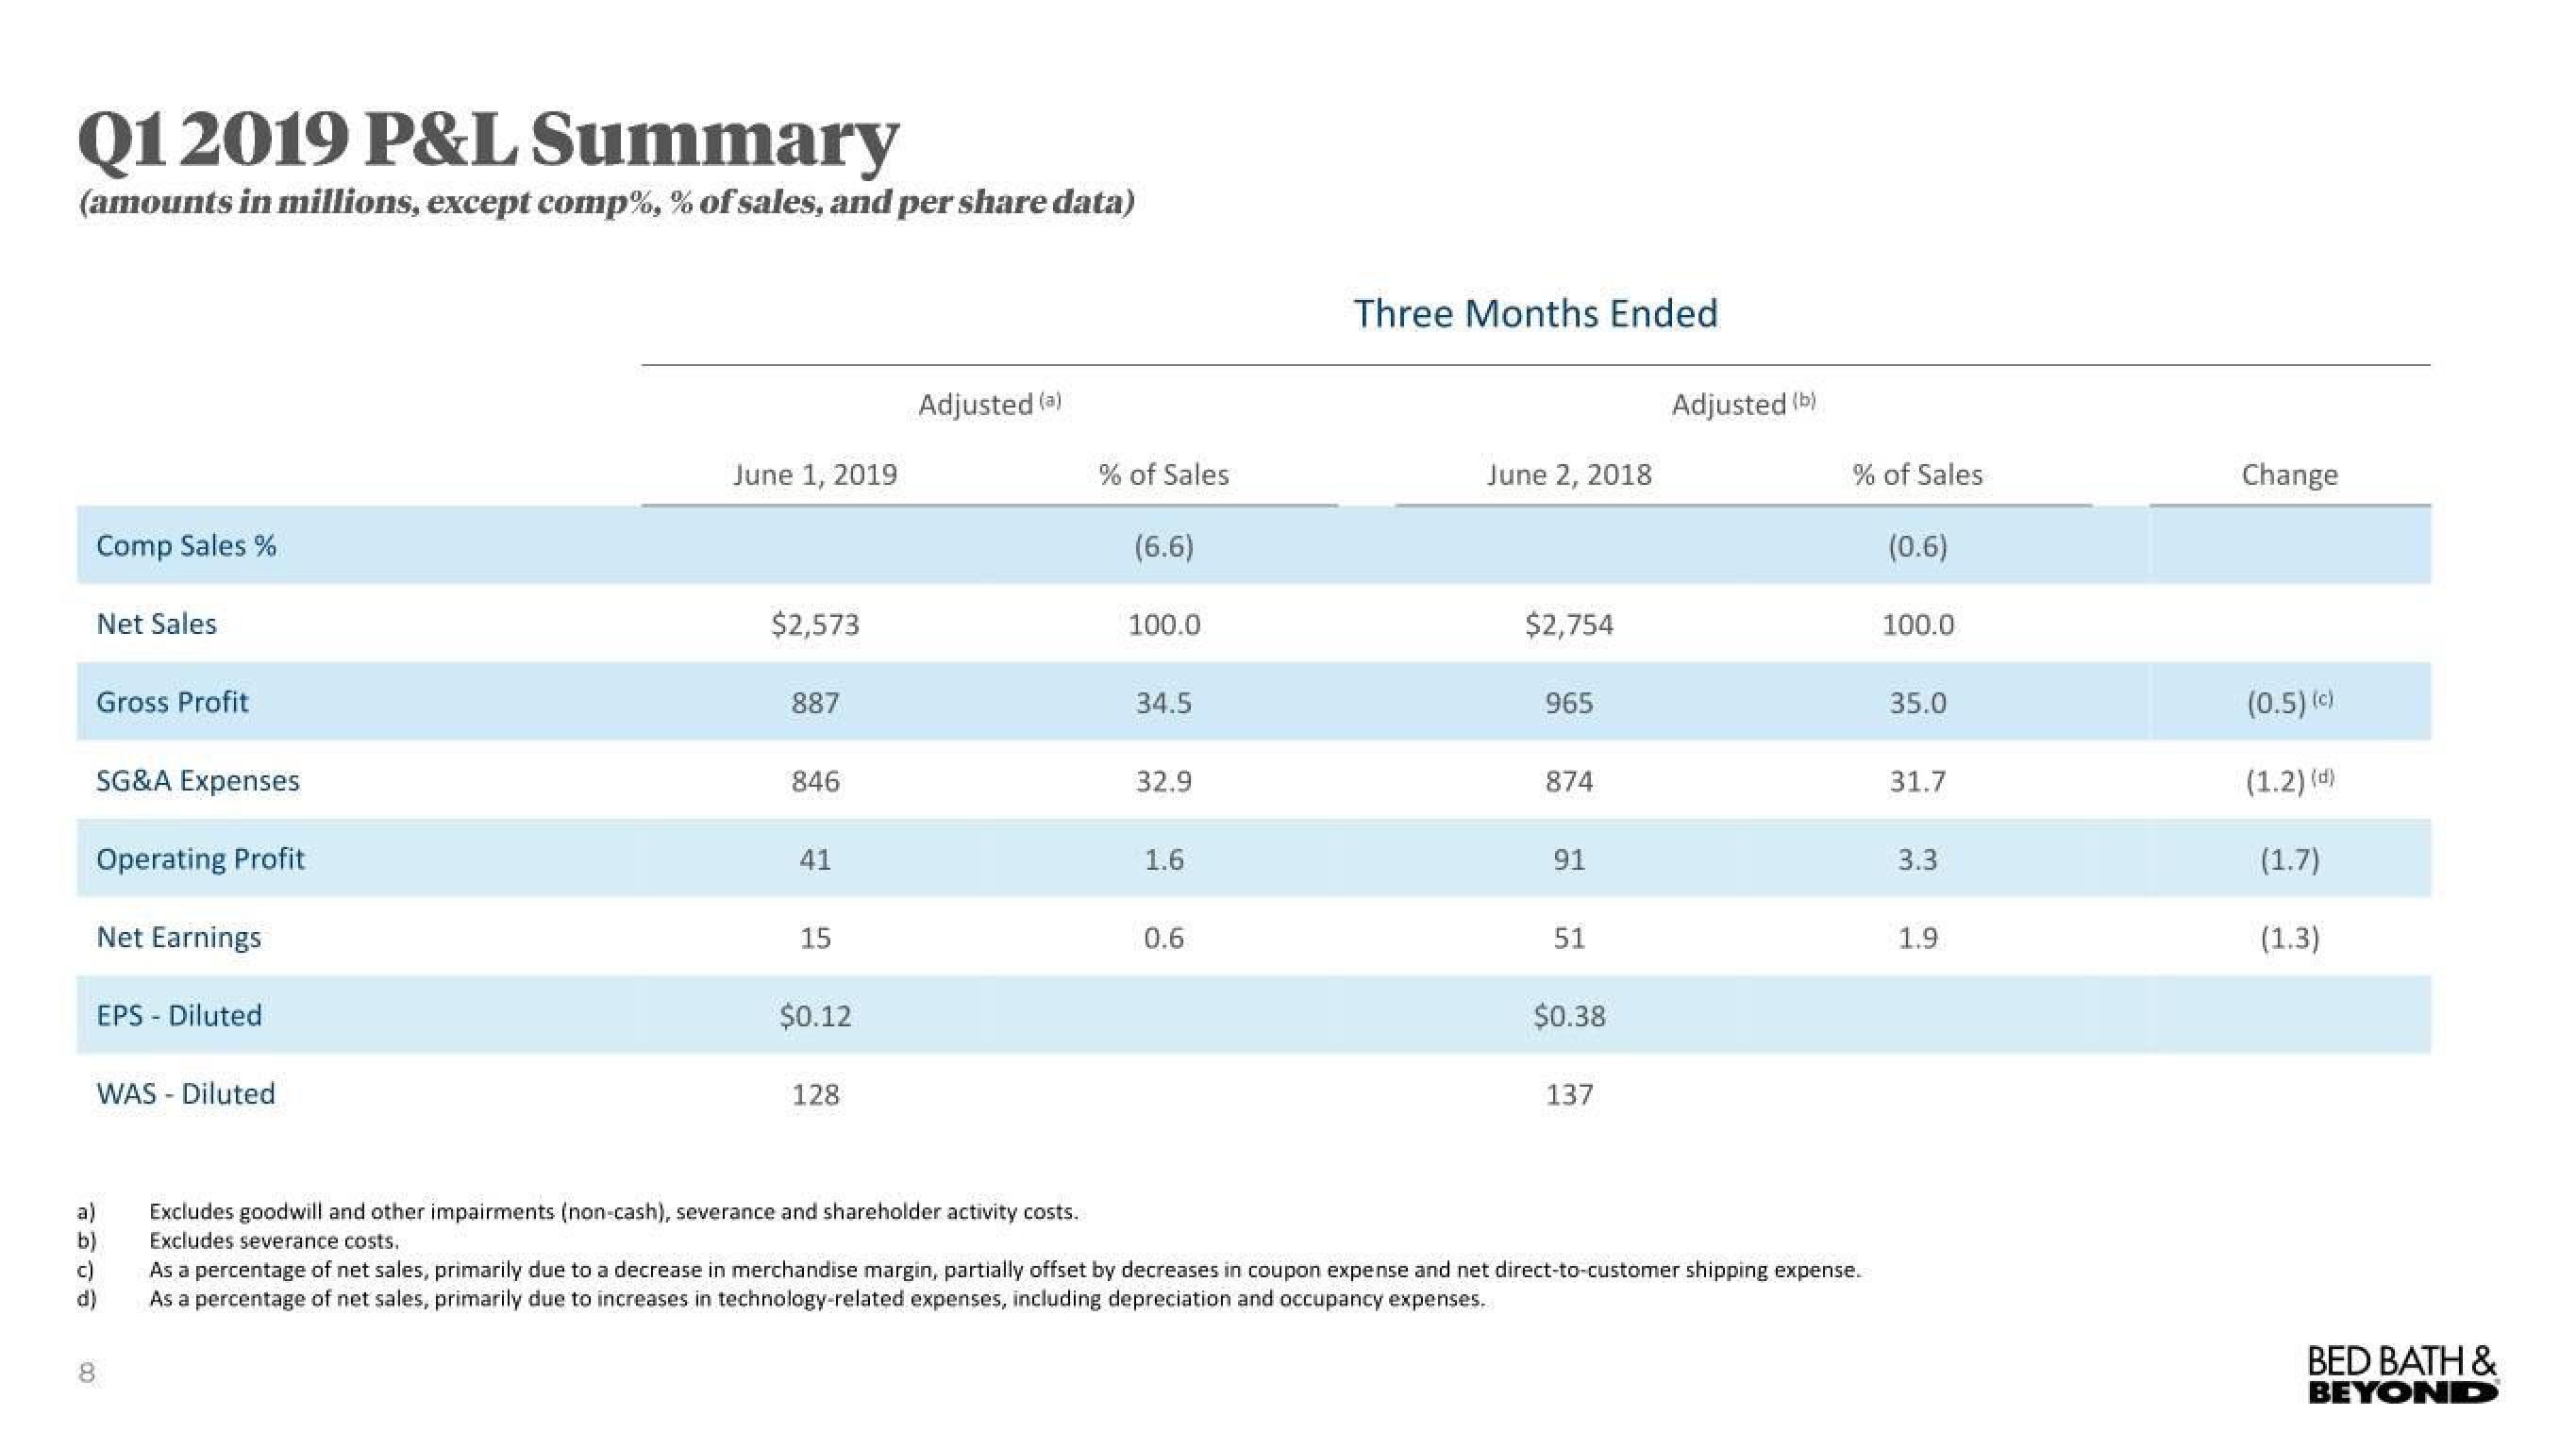
Q1 2019 P&L Summary
(amounts in millions, except comp%, % of sales, and per share data)
Comp Sales %
Net Sales
Gross Profit
SG&A Expenses
Operating Profit
Net Earnings
EPS - Diluted
WAS - Diluted
8
a)
b)
c)
d)
June 1, 2019
$2,573
887
846
41
15
$0.12
128
Adjusted (a)
Excludes goodwill and other impairments (non-cash), severance and shareholder activity costs.
Excludes severance costs.
% of Sales
(6.6)
100.0
34.5
32.9
1.6
0.6
Three Months Ended
June 2, 2018
$2,754
965
874
91
51
$0.38
137
Adjusted (b)
% of Sales
As a percentage of net sales, primarily due to a decrease in merchandise margin, partially offset by decreases in coupon expense and net direct-to-customer shipping expense.
As a percentage of net sales, primarily due to increases in technology-related expenses, including depreciation and occupancy expenses.
(0.6)
100.0
35.0
31.7
3.3
1.9
Change
(0.5) (c)
(1.2) (d)
(1.7)
(1.3)
BED BATH &
BEYONDView entire presentation