Grab SPAC Presentation Deck
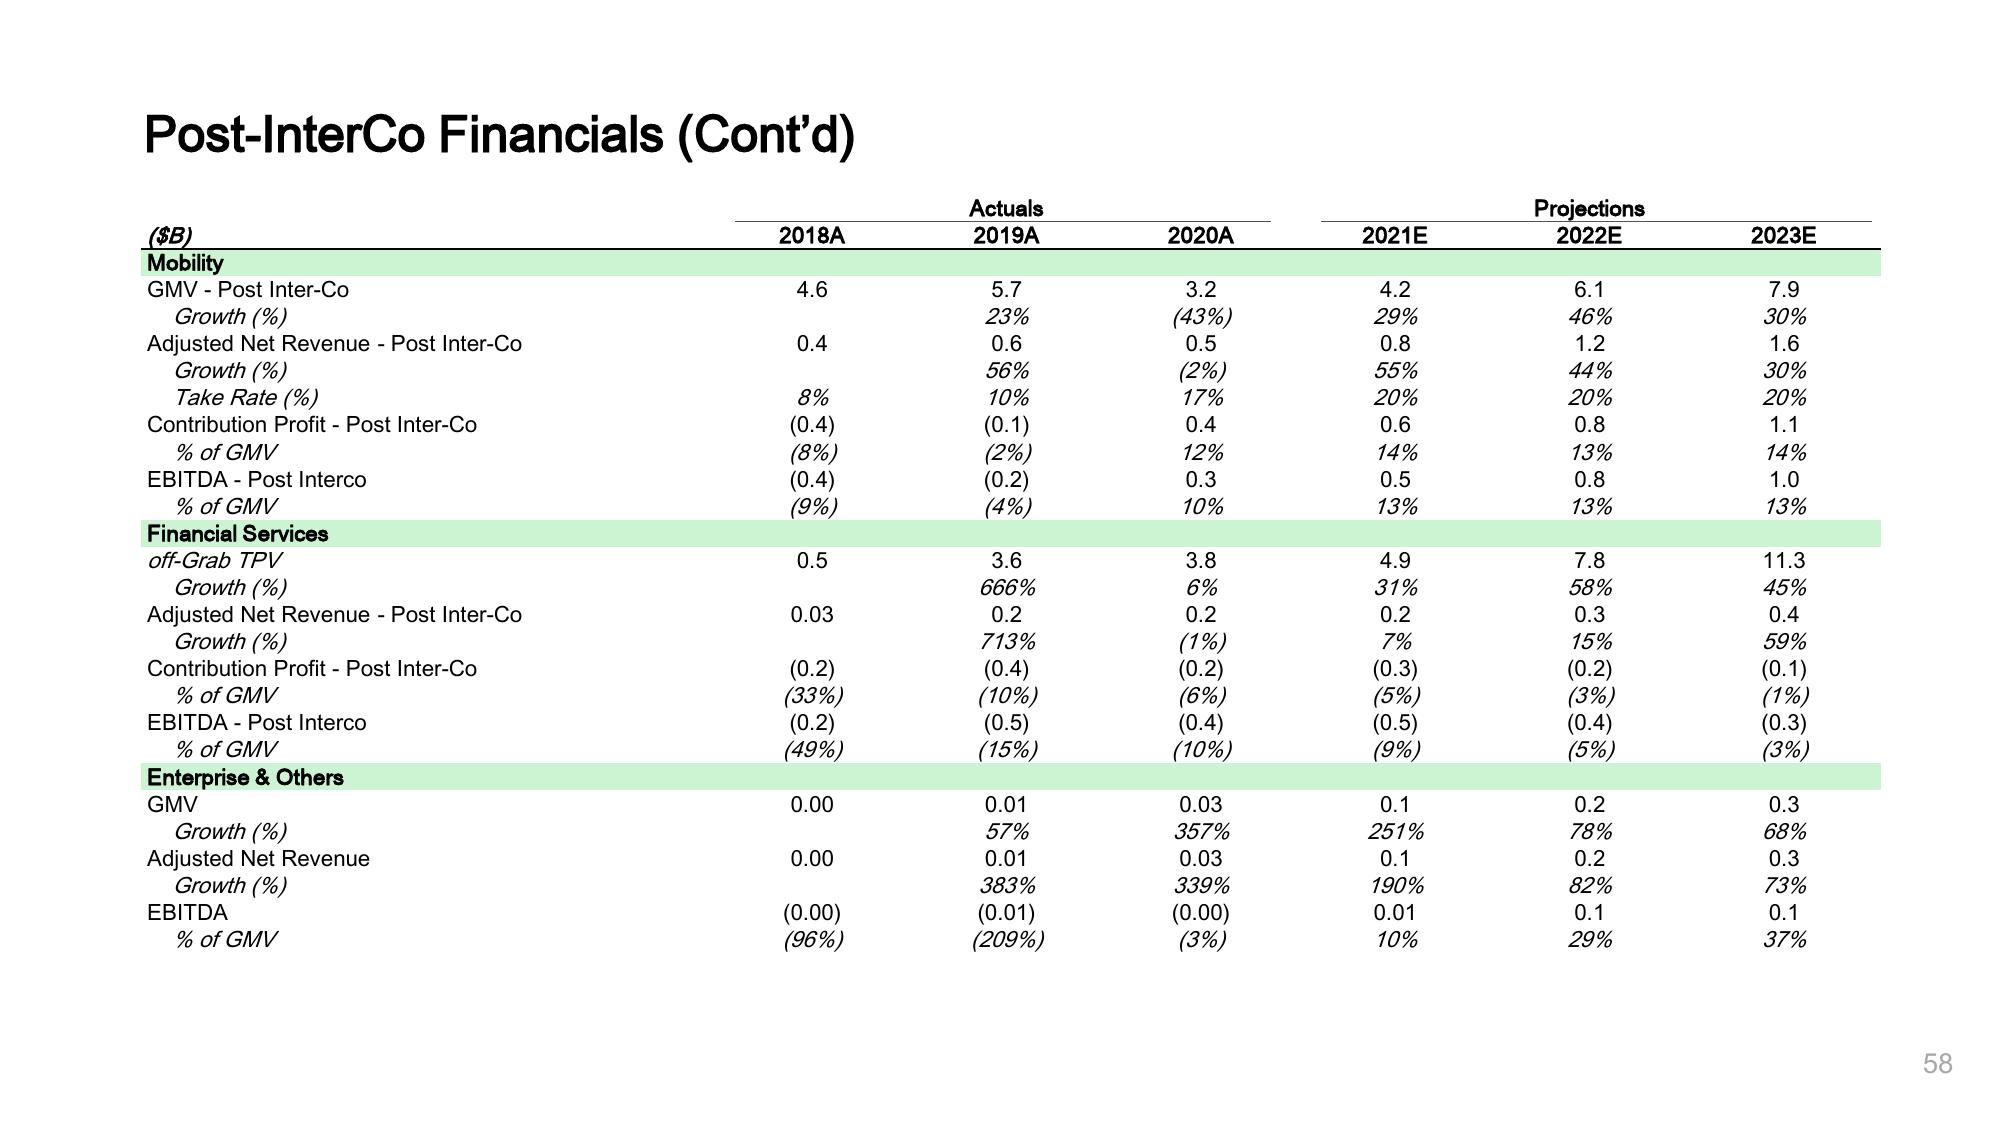
Post-InterCo Financials (Cont'd)
($B)
Mobility
GMV - Post Inter-Co
Growth (%)
Adjusted Net Revenue - Post Inter-Co
Growth (%)
Take Rate (%)
Contribution Profit - Post Inter-Co
% of GMV
EBITDA Post Interco
% of GMV
Financial Services
off-Grab TPV
Growth (%)
Adjusted Net Revenue - Post Inter-Co
Growth (%)
Contribution Profit - Post Inter-Co
% of GMV
EBITDA - Post Interco
% of GMV
Enterprise & Others
GMV
Growth (%)
Adjusted Net Revenue
Growth (%)
EBITDA
% of GMV
2018A
4.6
0.4
8%
(0.4)
(8%)
(0.4)
(9%)
0.5
0.03
(0.2)
(33%)
(0.2)
(49%)
0.00
0.00
(0.00)
(96%)
Actuals
2019A
5.7
23%
0.6
56%
10%
(0.1)
(2%)
(0.2)
(4%)
3.6
666%
0.2
713%
(0.4)
(10%)
(0.5)
(15%)
0.01
57%
0.01
383%
(0.01)
(209%)
2020A
3.2
(43%)
0.5
(2%)
17%
0.4
12%
0.3
10%
3.8
6%
0.2
(1%)
(0.2)
(6%)
(0.4)
(10%)
0.03
357%
0.03
339%
(0.00)
(3%)
2021E
4.2
29%
0.8
55%
20%
0.6
14%
0.5
13%
4.9
31%
0.2
7%
(0.3)
(5%)
(0.5)
(9%)
0.1
251%
0.1
190%
0.01
10%
Projections
2022E
6.1
46%
1.2
44%
20%
0.8
13%
0.8
13%
7.8
58%
0.3
15%
(0.2)
(3%)
(0.4)
(5%)
0.2
78%
0.2
82%
0.1
29%
2023E
7.9
30%
1.6
30%
20%
1.1
14%
1.0
13%
11.3
45%
0.4
59%
(0.1)
(1%)
(0.3)
(3%)
0.3
68%
0.3
73%
0.1
37%
58View entire presentation