Inovalon Results Presentation Deck
Full Year 2020 Financial Guidance
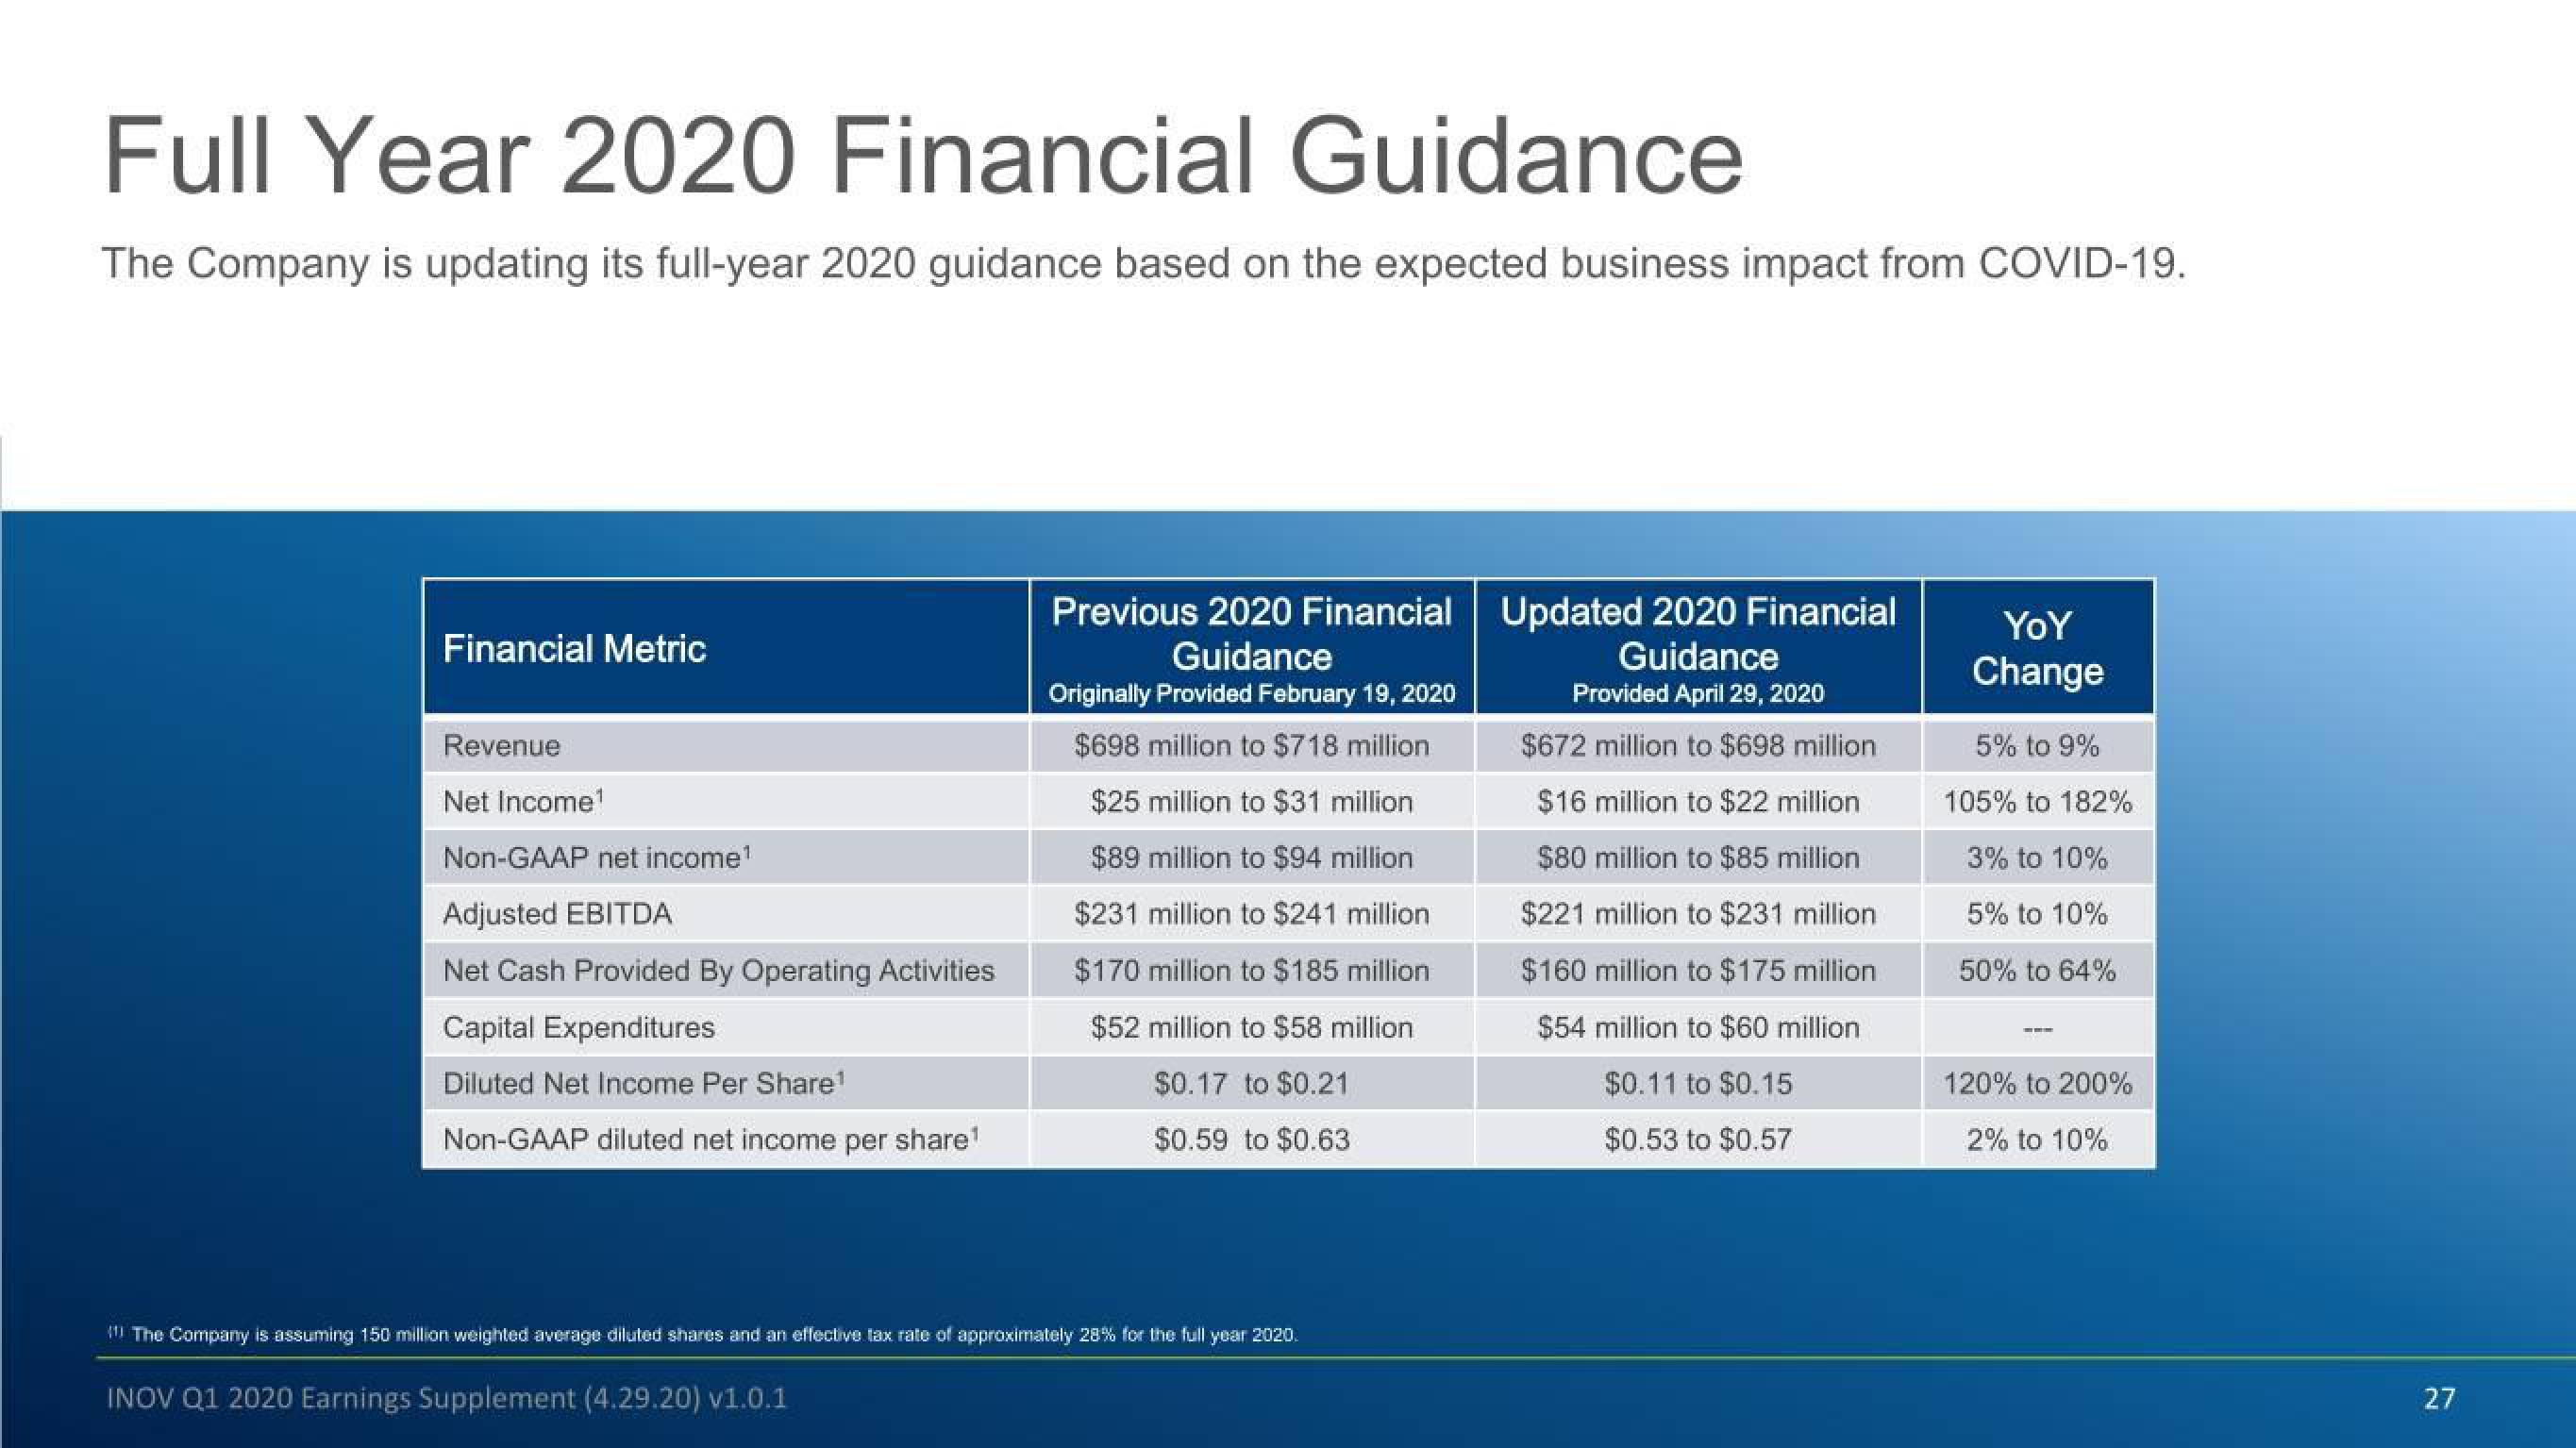
The Company is updating its full-year 2020 guidance based on the expected business impact from COVID-19.
Financial Metric
Revenue
Net Income1¹
Non-GAAP net income¹
Adjusted EBITDA
Net Cash Provided By Operating Activities
Capital Expenditures
Diluted Net Income Per Share¹
Non-GAAP diluted net income per share¹
Previous 2020 Financial | Updated 2020 Financial
Guidance
Guidance
Originally Provided February 19, 2020
$698 million to $718 million
$25 million to $31 million
$89 million to $94 million
$231 million to $241 million
$170 million to $185 million
$52 million to $58 million
$0.17 to $0.21
$0.59 to $0.63
Provided April 29, 2020
$672 million to $698 million
$16 million to $22 million
$80 million to $85 million
$221 million to $231 million
$160 million to $175 million
$54 million to $60 million
$0.11 to $0.15
$0.53 to $0.57
!!! The Company is assuming 150 million weighted average diluted shares and an effective tax rate of approximately 28% for the full year 2020.
INOV Q1 2020 Earnings Supplement (4.29.20) v1.0.1
YOY
Change
5% to 9%
105% to 182%
3% to 10%
5% to 10%
50% to 64%
120% to 200%
2% to 10%
27View entire presentation