OpenText Investor Presentation Deck
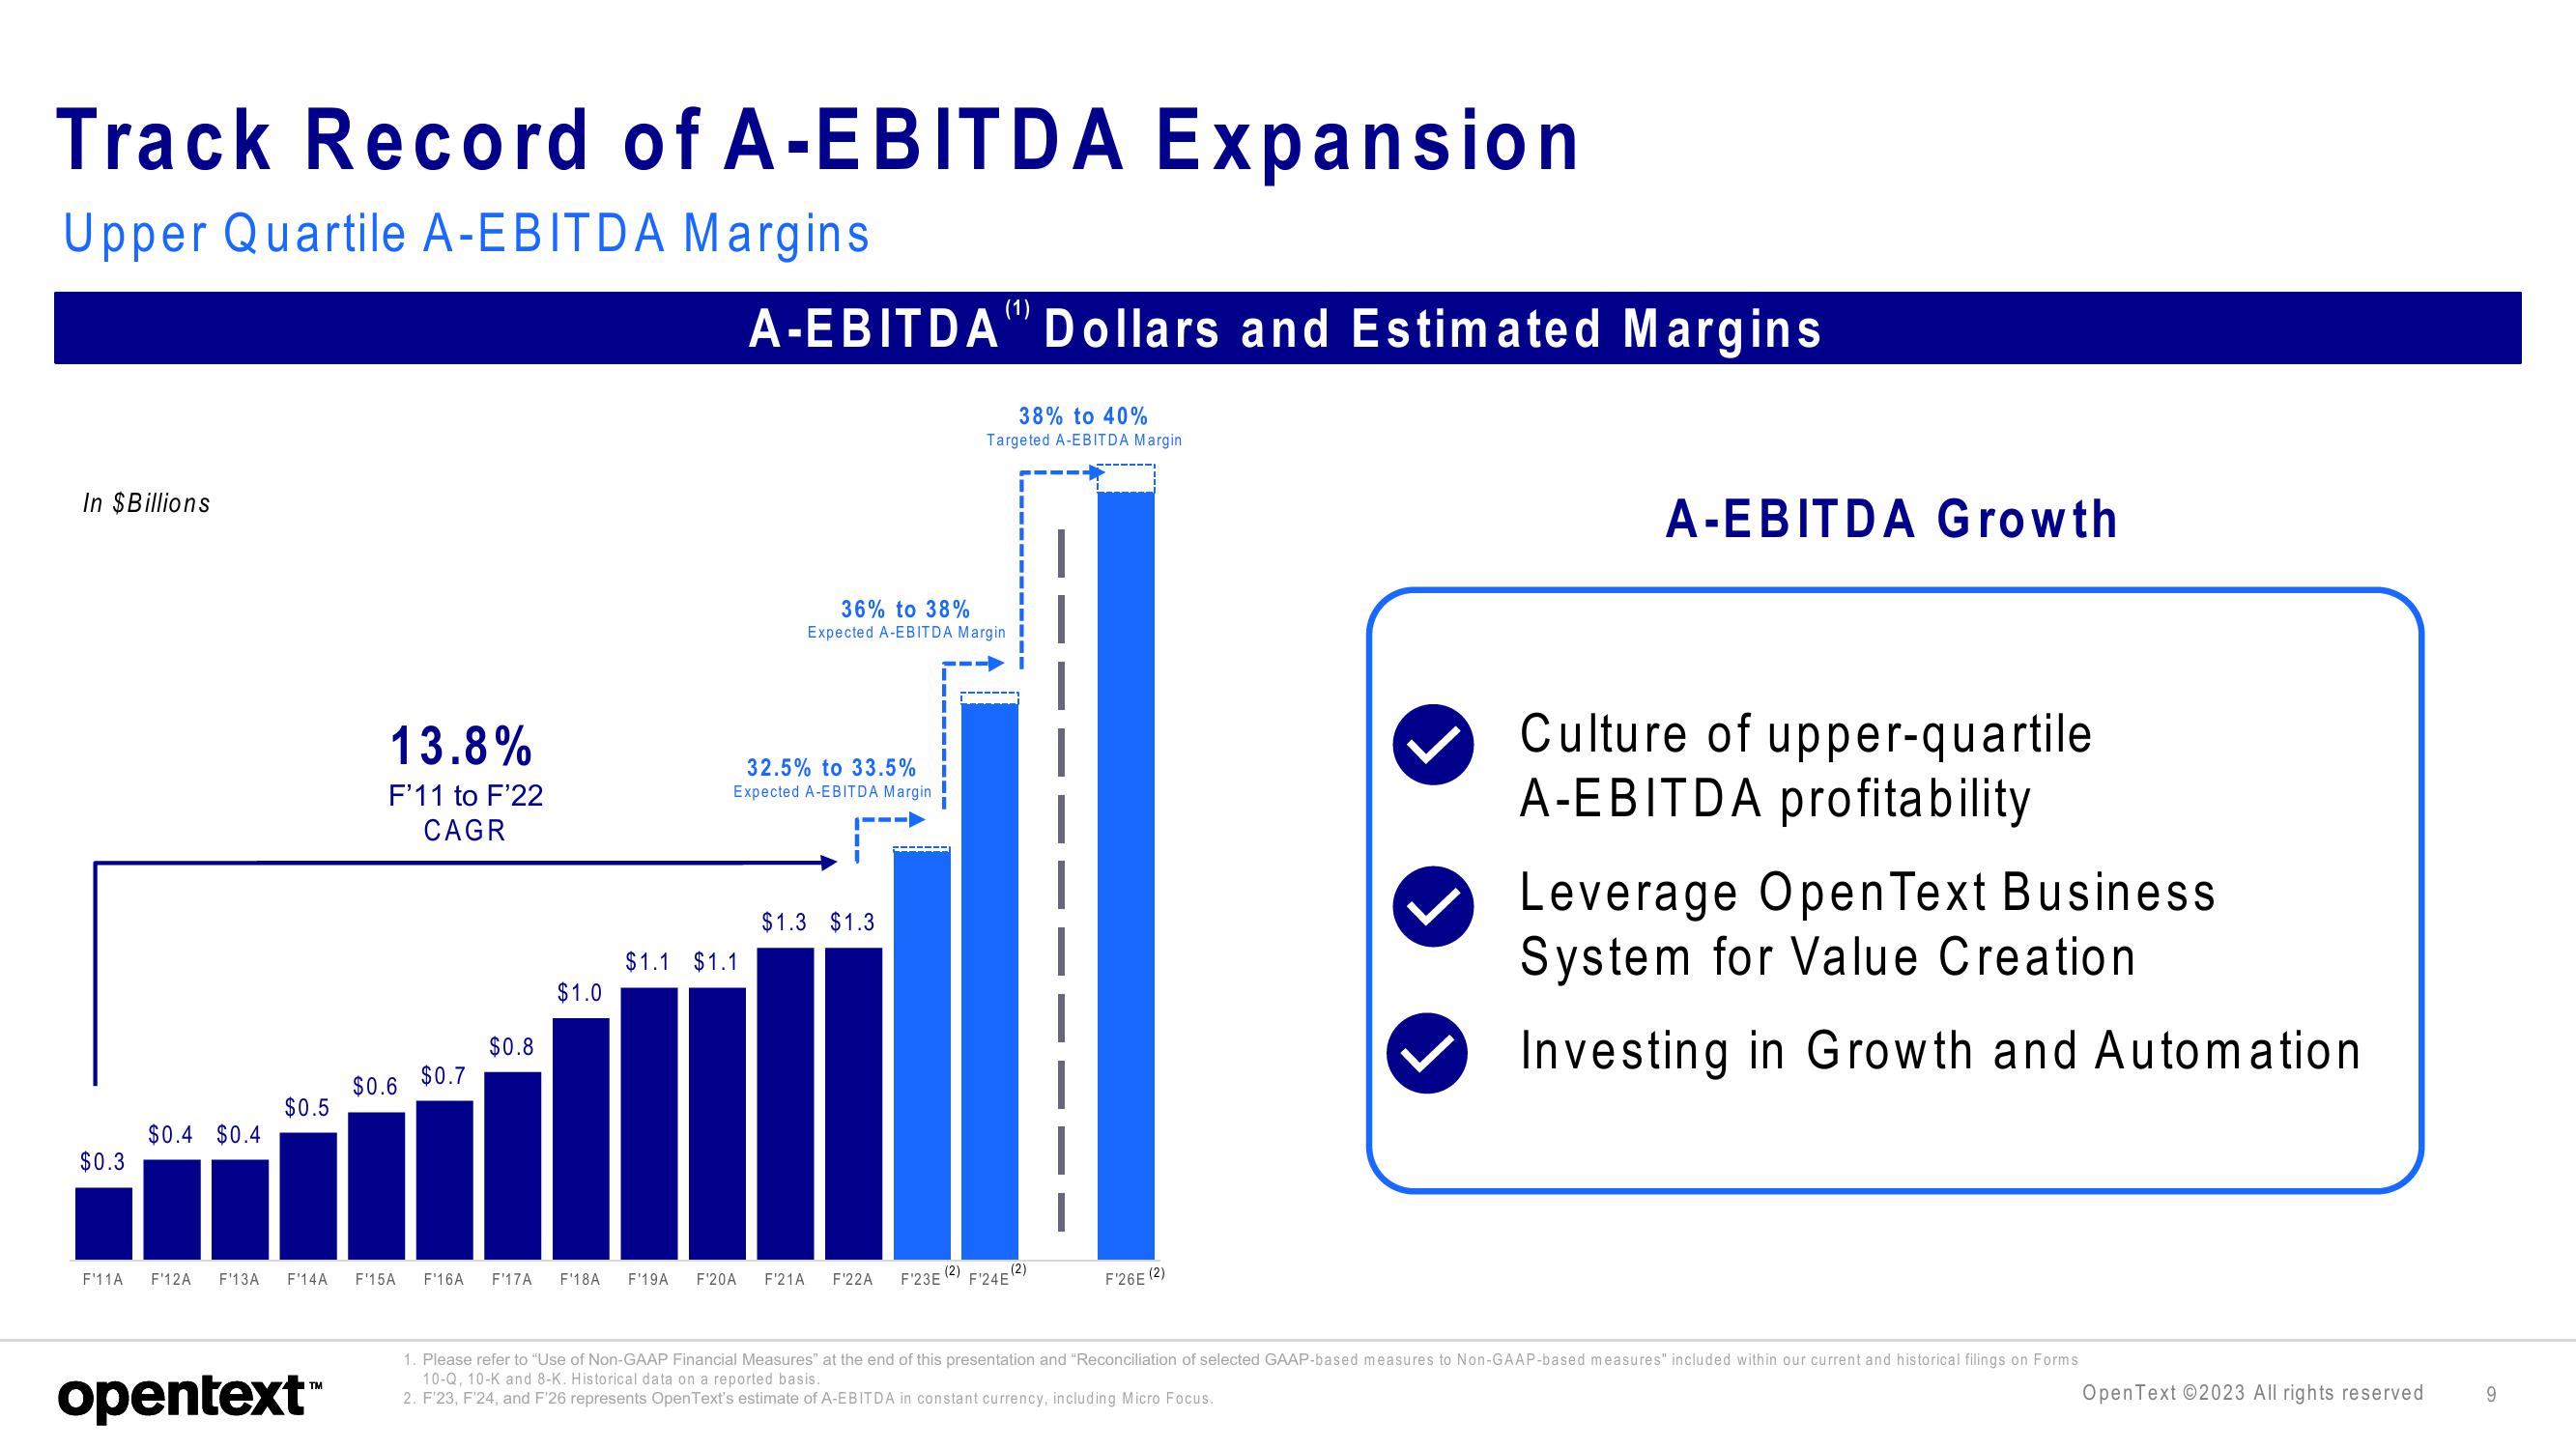
Track Record of A-EBITDA Expansion
Upper Quartile A-EBITDA Margins
In $Billions
$0.3
F'11A
$0.4 $0.4
$0.5
F'12A F'13A F'14A
opentext™
13.8%
F'11 to F'22
CAGR
$0.6
$0.7
$0.8
$1.0
$1.1 $1.1
A-EBITDA Dollars and Estimated Margins
38% to 40%
Targeted A-EBITDA Margin
32.5% to 33.5%
Expected A-EBITDA Margin
36% to 38%
Expected A-EBITDA Margin
(1)
$1.3 $1.3
F'15A F'16A F'17A F¹18A F'19A F'20A F'21A F'22A
F'23E F'24E
(2)
(2)
F'26E (2)
A-EBITDA Growth
Culture of upper-quartile
A-EBITDA profitability
Leverage Open Text Business
System for Value Creation.
Investing in Growth and Automation
1. Please refer to "Use of Non-GAAP Financial Measures" at the end of this presentation and "Reconciliation of selected GAAP-based measures to Non-GAAP-based measures" included within our current and historical filings on Forms
10-Q, 10-K and 8-K. Historical data on a reported basis.
2. F'23, F'24, and F'26 represents OpenText's estimate of A-EBITDA in constant currency, including Micro Focus.
Open Text ©2023 All rights reserved
9View entire presentation