Kymera Investor Presentation Deck
KT-474 Concentration (ng/mL)
Mean (+ SE)
20
15
10
5
C
●
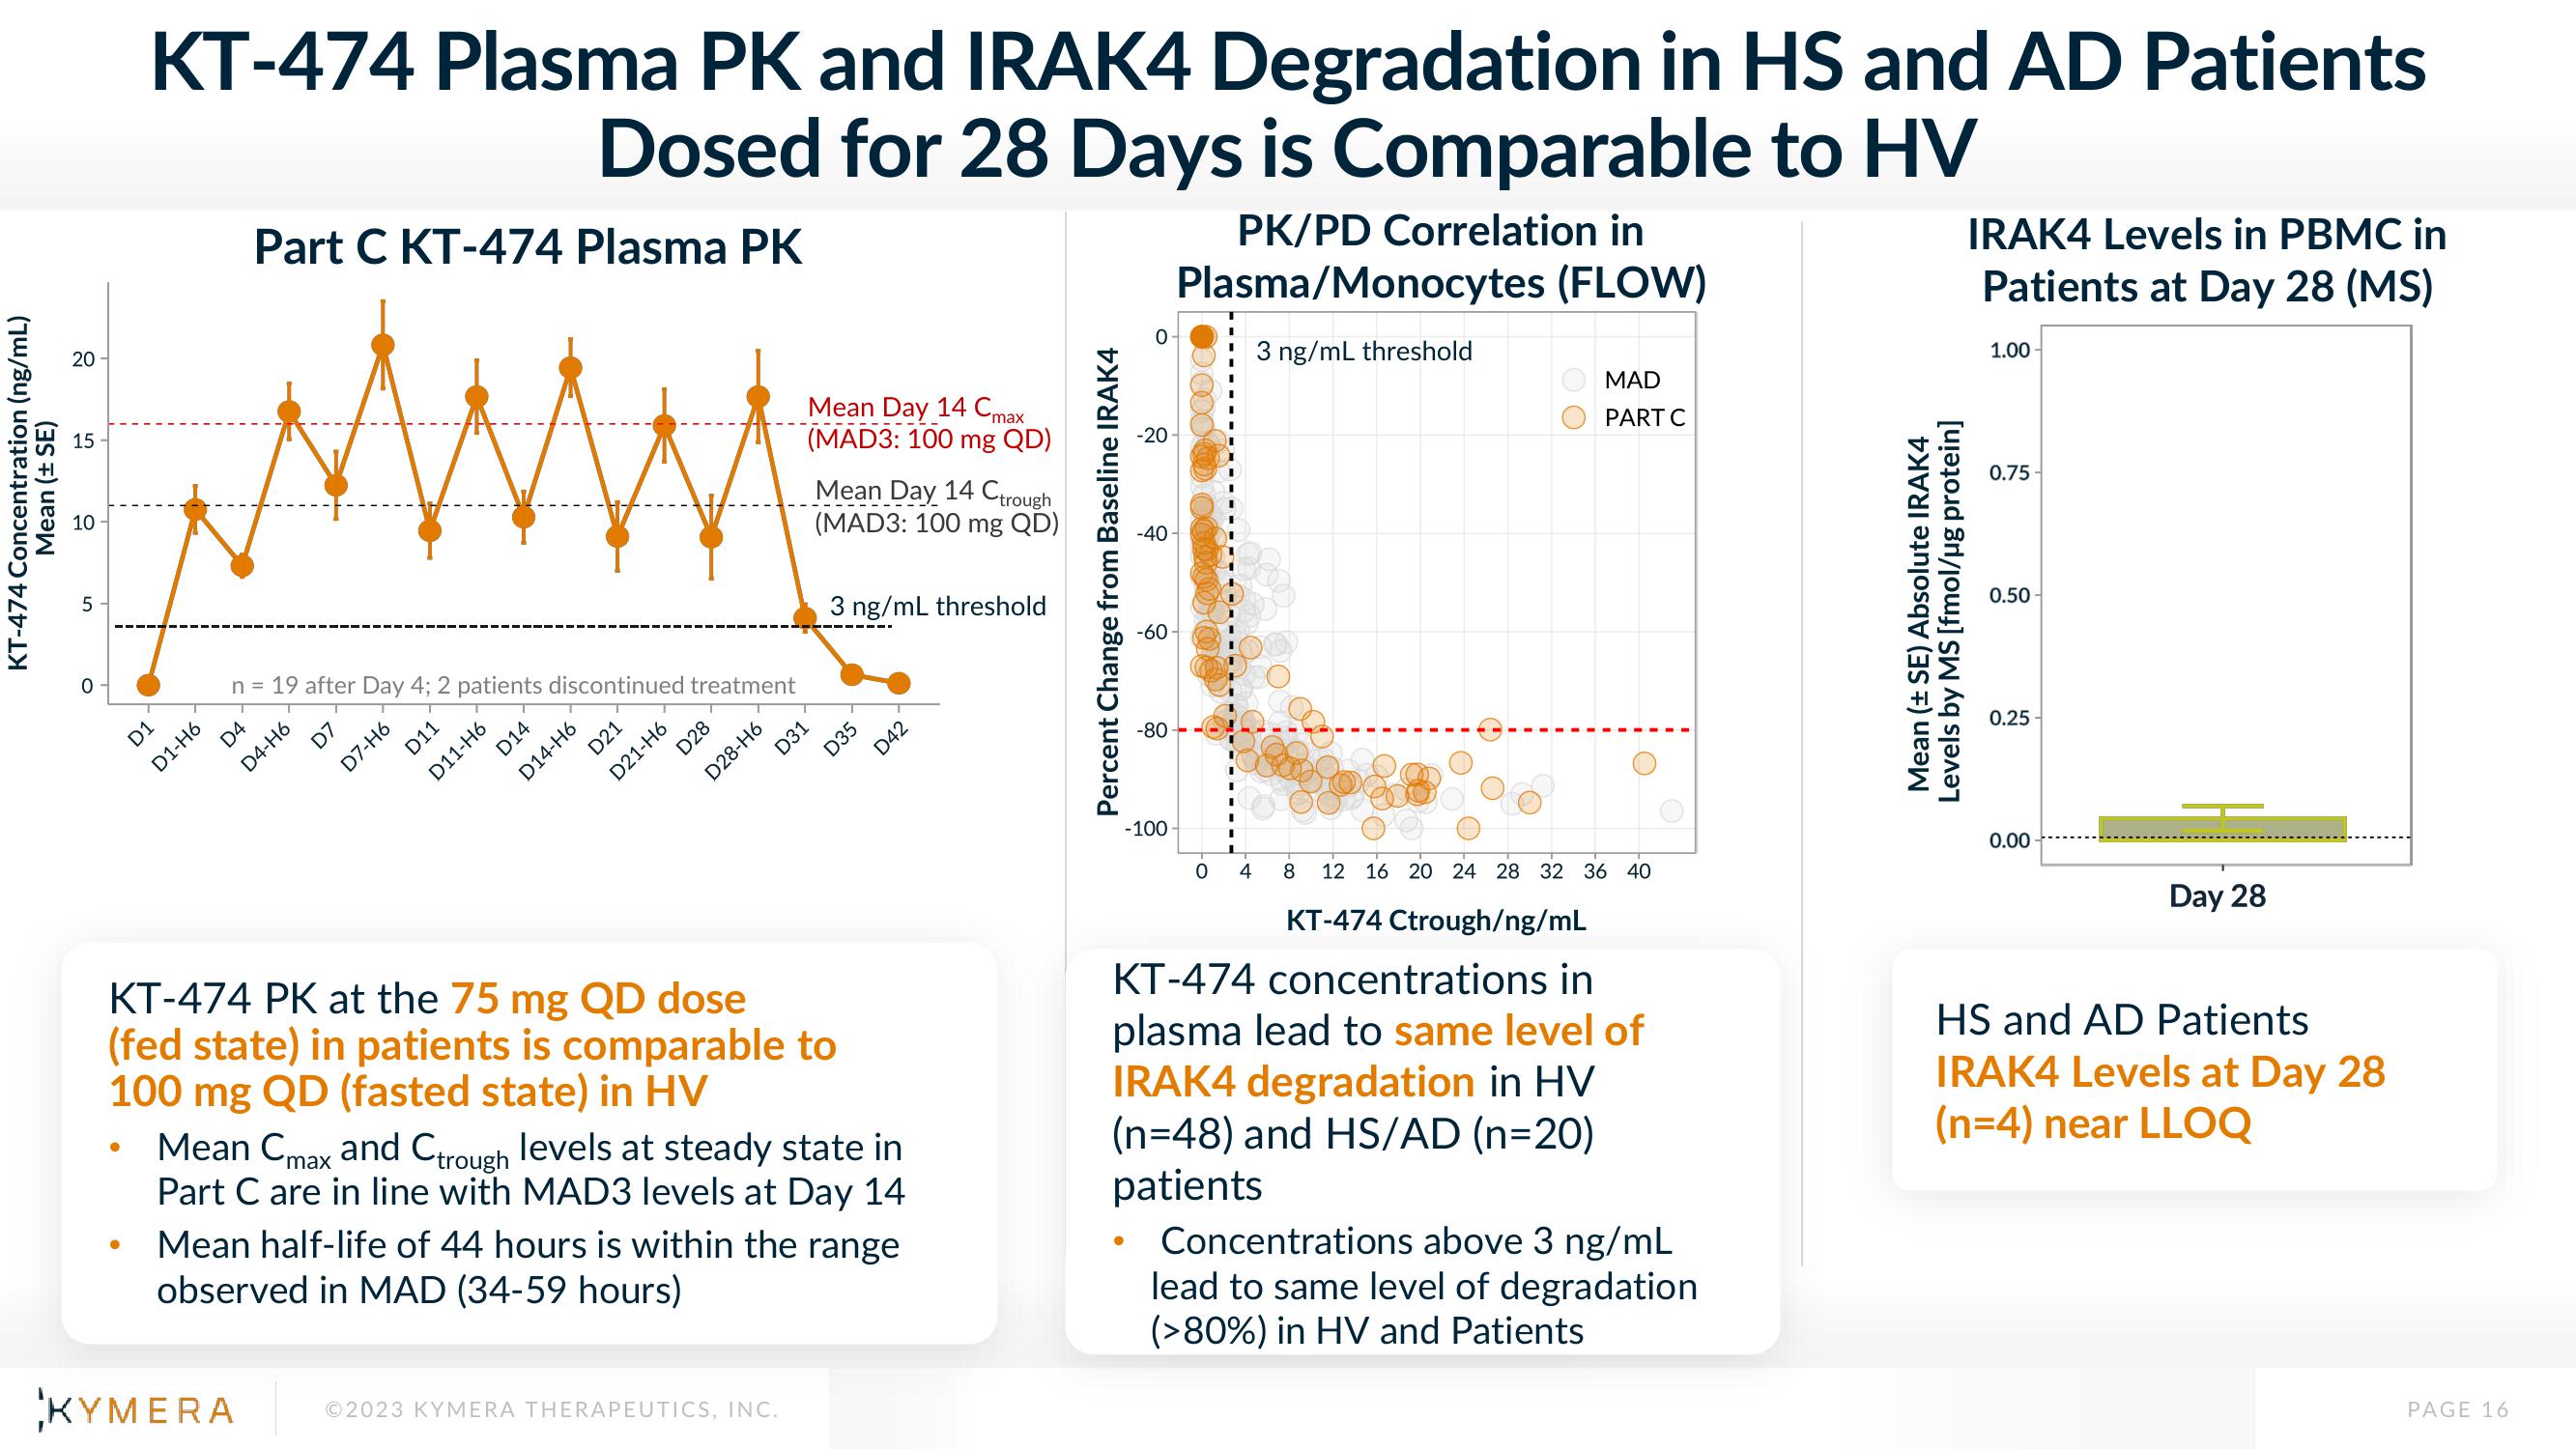
KT-474 Plasma PK and IRAK4 Degradation in HS and AD Patients
Dosed for 28 Days is Comparable to HV
Part C KT-474 Plasma PK
●
D1
D1-H6
n =
19 after Day 4; 2 patients discontinued treatment
D4
D4-H6
D7-H6
D7
D11
D11-H6
D14
D14-H6
D21
D21-H6
D28
D28-H6
Mean Day 14 Cmax
(MAD3: 100 mg QD)
Mean Day 14 Ctrough
(MAD3: 100 mg QD)
KT-474 PK at the 75 mg QD dose
(fed state) in patients is comparable to
100 mg QD (fasted state) in HV
D31
KYMERA ©2023 KYMERA THERAPEUTICS, INC.
3 ng/mL threshold
D35
D42
Mean Cmax and Ctrough levels at steady state in
Part C are in line with MAD3 levels at Day 14
Mean half-life of 44 hours is within the range
observed in MAD (34-59 hours)
Percent Change from Baseline IRAK4
0
-20-
-40-
-60-
-80
-100-
PK/PD Correlation in
Plasma/Monocytes (FLOW)
0
4
3 ng/mL threshold
MAD
PART C
8 12 16 20 24 28 32 36 40
KT-474 Ctrough/ng/mL
KT-474 concentrations in
plasma lead to same level of
IRAK4 degradation in HV
(n=48) and HS/AD (n=20)
patients
Concentrations above 3 ng/mL
lead to same level of degradation
(>80%) in HV and Patients
protein]
Mean (± SE) Absolute IRAK4
Levels by MS [fmol/µg
IRAK4 Levels in PBMC in
Patients at Day 28 (MS)
1.00-
0.75
0.50
0.25
0.00
Day 28
HS and AD Patients
IRAK4 Levels at Day 28
(n=4) near LLOQ
PAGE 16View entire presentation