Q2 Quarter 2023
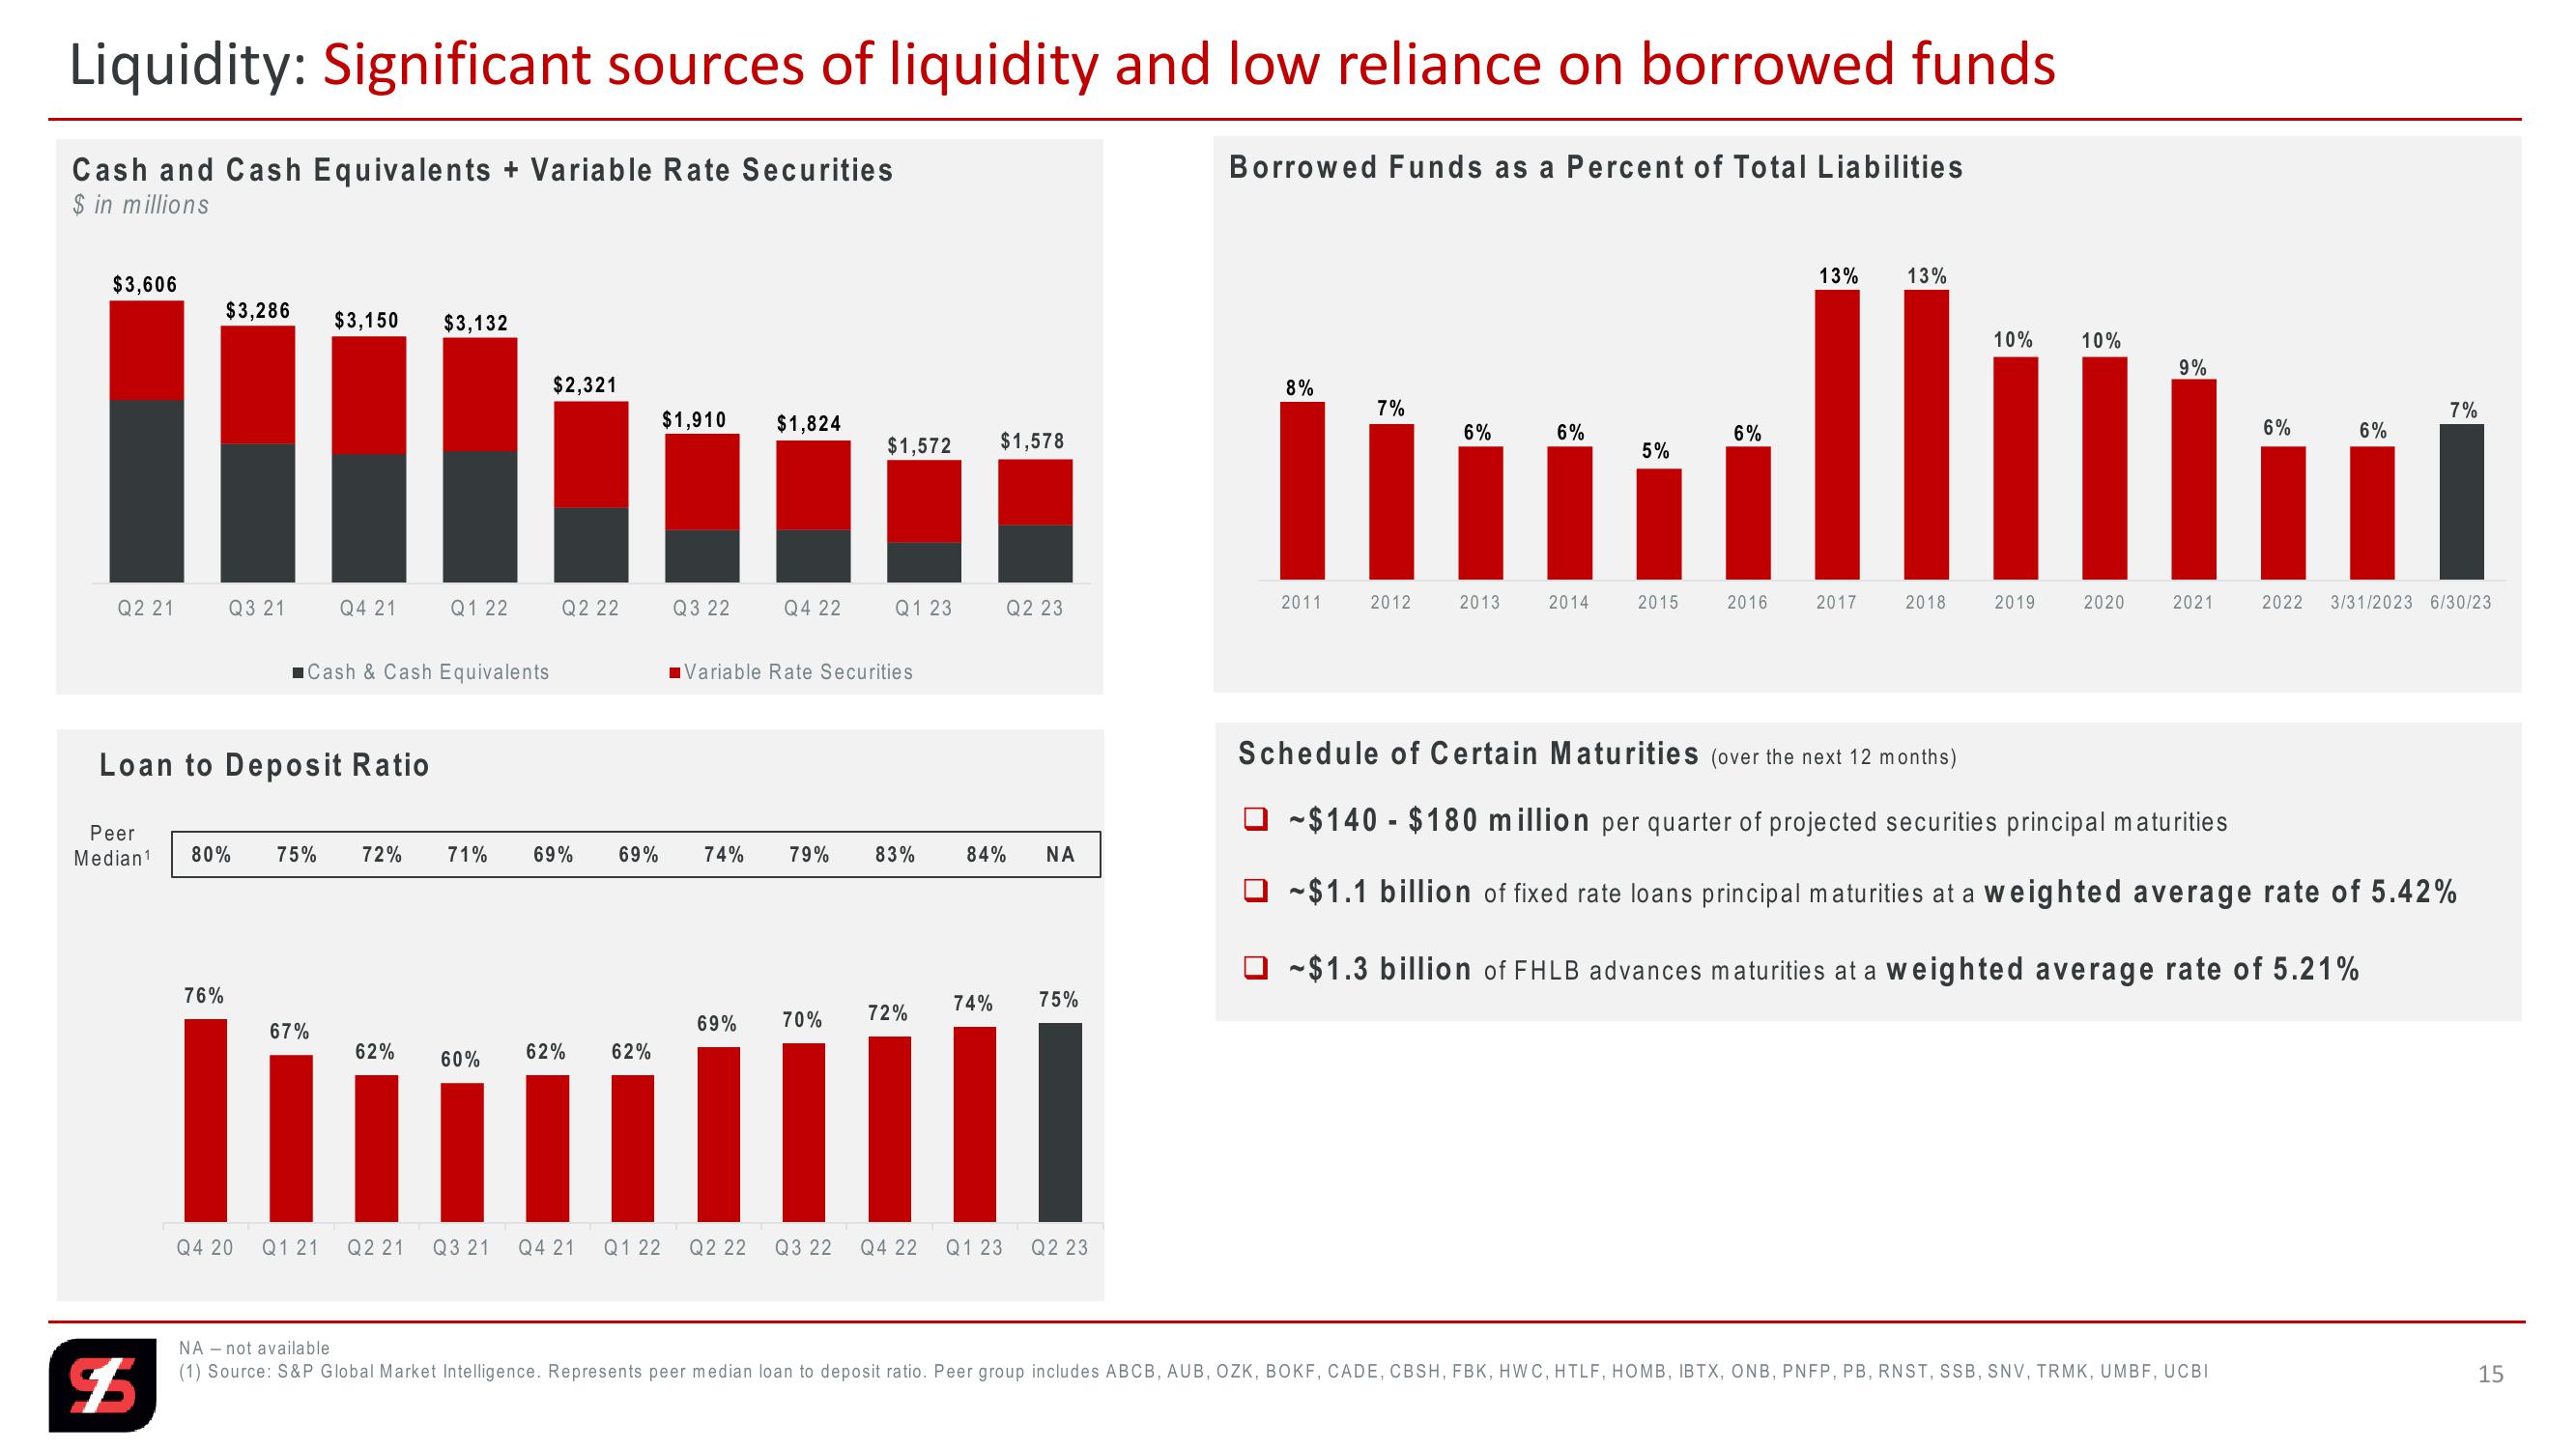
Liquidity: Significant sources of liquidity and low reliance on borrowed funds
Cash and Cash Equivalents + Variable Rate Securities
$ in millions
Borrowed Funds as a Percent of Total Liabilities
Q1 22
Q2 22
Q3 22
Q4 22
Q1 23
Q2 23
2011
2012
2013
2014
2015
2016
2017
2018
2019
2020
2021
2022
3/31/2023 6/30/23
ווווו-ויי ווייייווווויי
$3,606
13%
13%
7%
Q2 21
Q3 21
Q4 21
■Cash & Cash Equivalents
Loan to Deposit Ratio
Peer
Median¹ 80% 75% 72% 71%
■Variable Rate Securities
69% 69%
74% 79%
83%
84% NA
Schedule of Certain Maturities (over the next 12 months)
~$140 $180 million per quarter of projected securities principal maturities
~$1.1 billion of fixed rate loans principal maturities at a weighted average rate of 5.42%
☐ ~$1.3 billion of FHLB advances maturities at a weighted average rate of 5.21%
76%
74%
75%
67%
69%
70% 72%
62%
60%
62%
62%
III
Q4 20 Q1 21
Q2 21
Q3 21
Q4 21
Q1 22
Q2 22
Q3 22
Q4 22
Q1 23
Q2 23
NA not available
$5
(1) Source: S&P Global Market Intelligence. Represents peer median loan to deposit ratio. Peer group includes ABCB, AUB, OZK, BOKF, CADE, CBSH, FBK, HWC, HTLF, HOMB, IBTX, ONB, PNFP, PB, RNST, SSB, SNV, TRMK, UMBF, UCBI
15View entire presentation