LVMH Results Presentation Deck
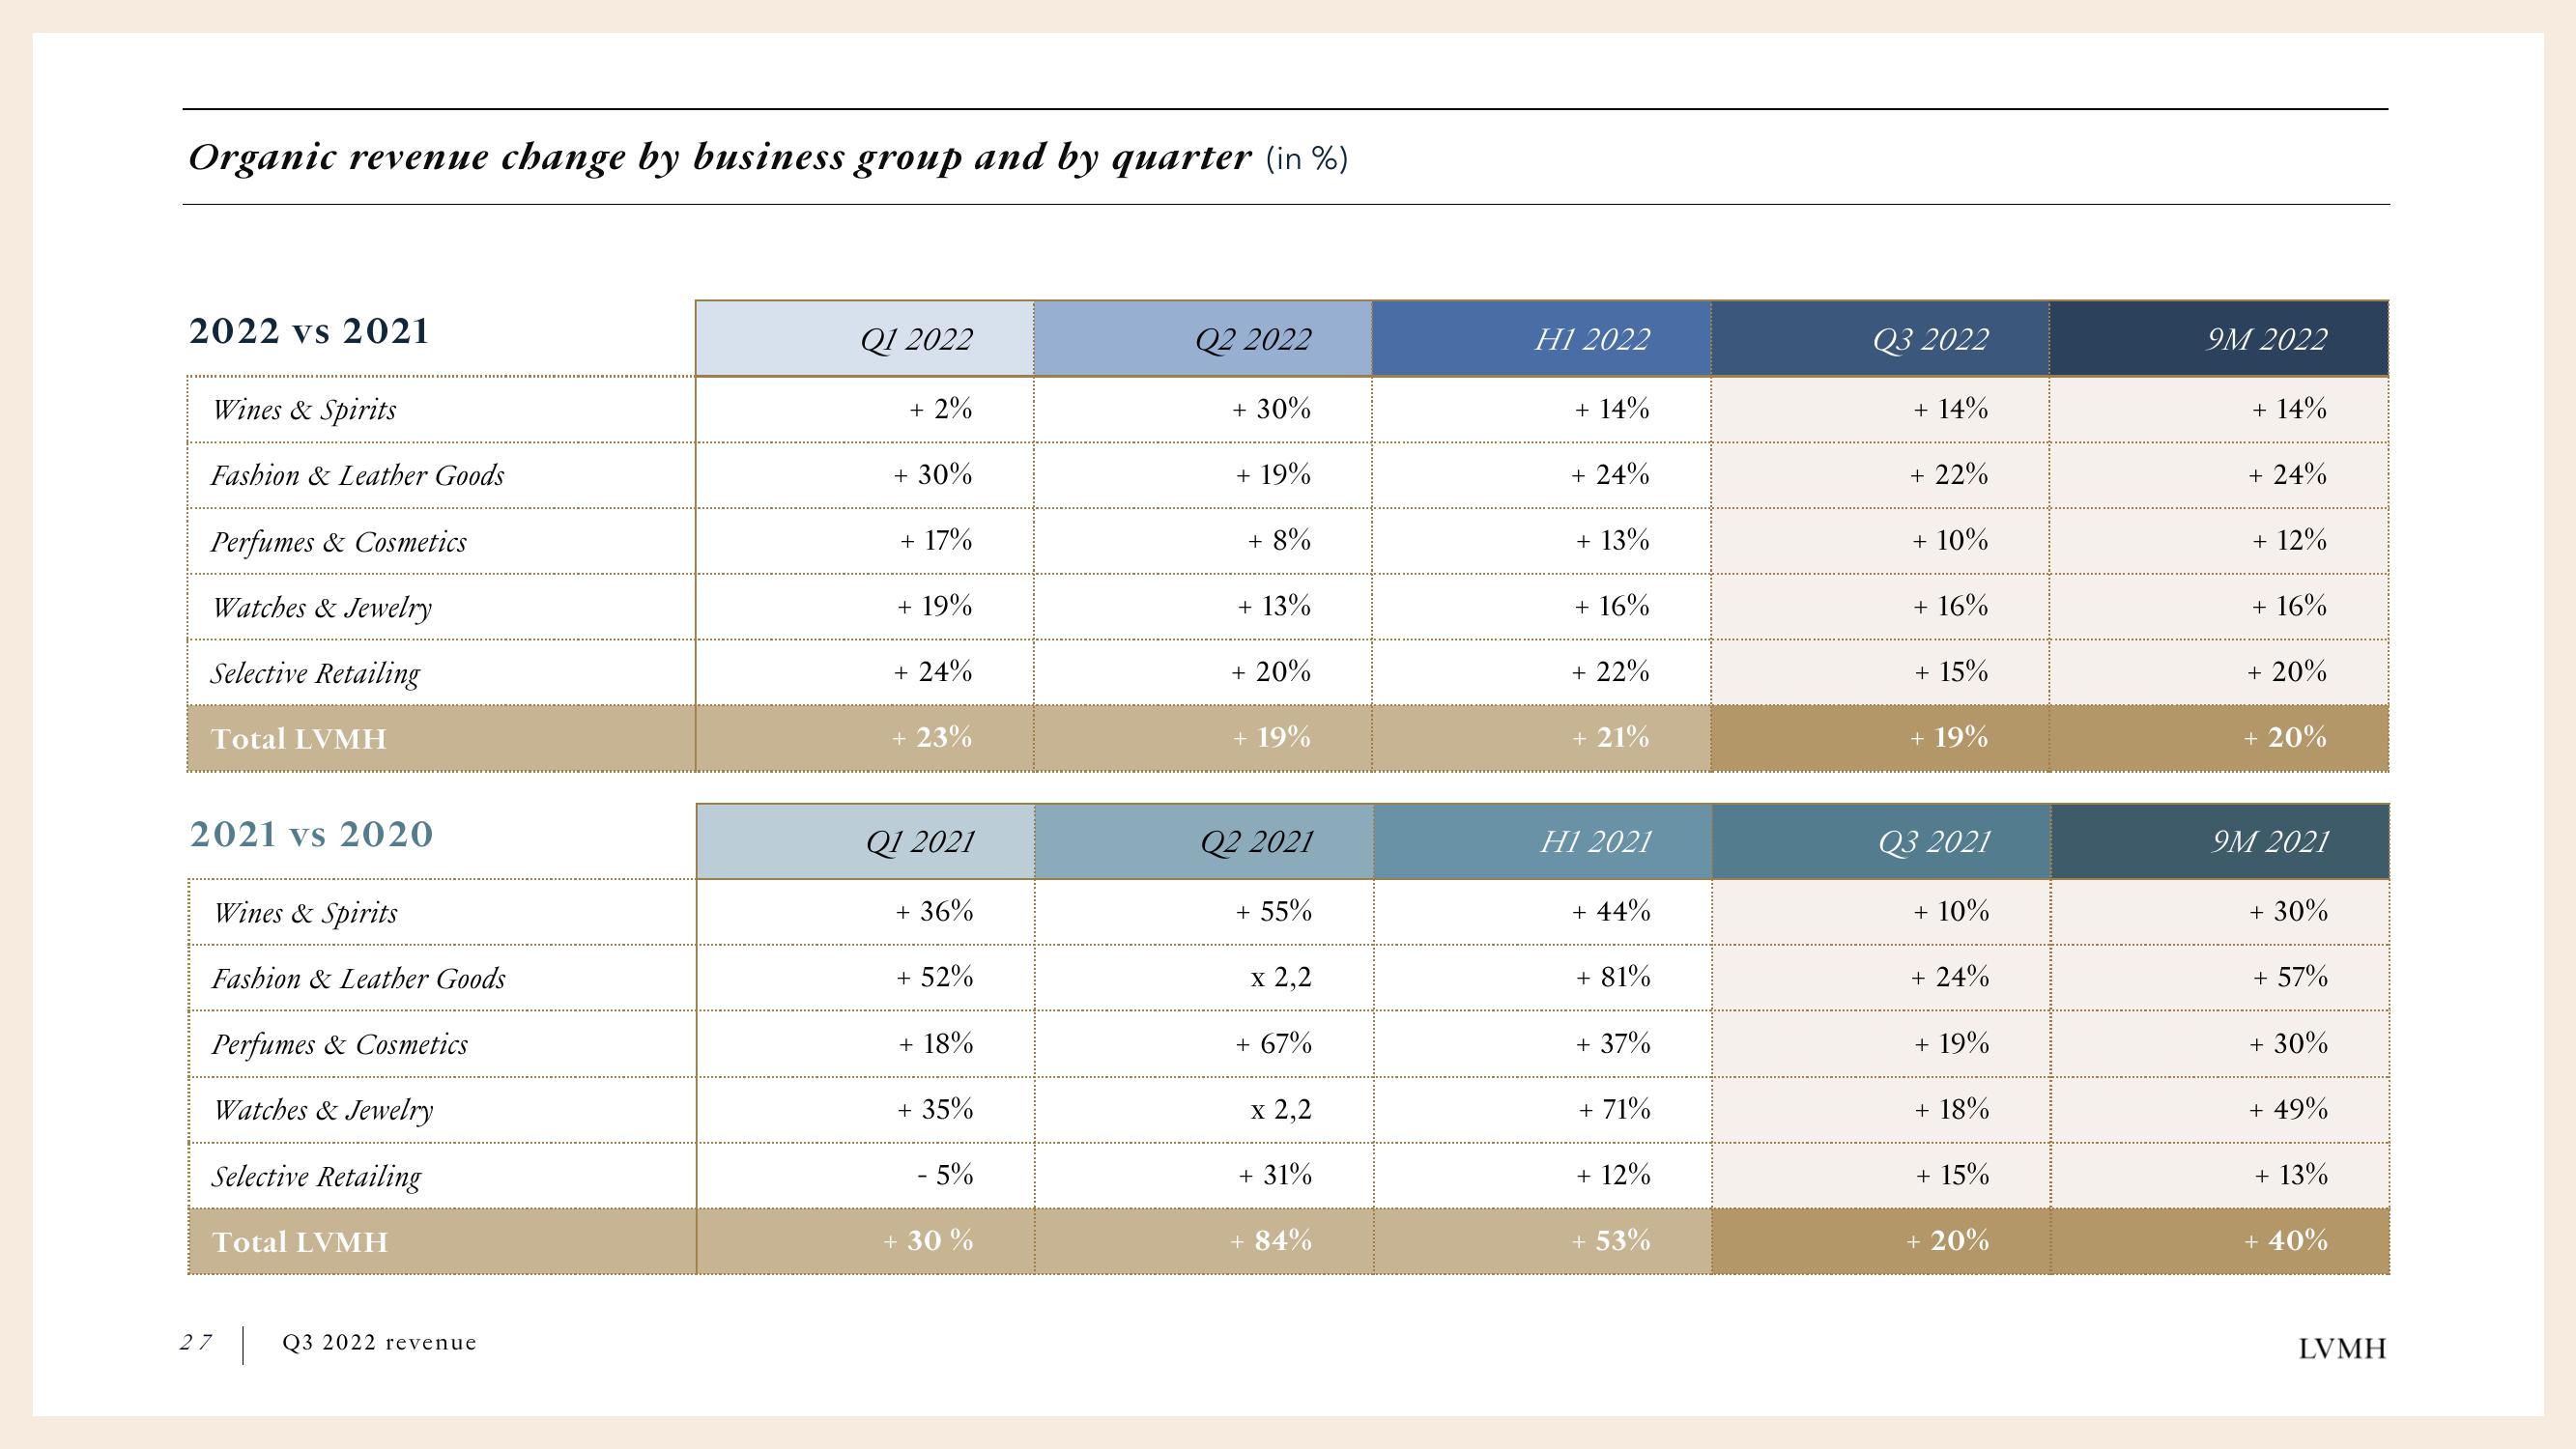
Organic revenue change by business group and by quarter (in %)
2022 vs 2021
Wines & Spirits
Fashion & Leather Goods
Perfumes & Cosmetics
Watches & Jewelry
Selective Retailing
Total LVMH
2021 vs 2020
Wines & Spirits
Fashion & Leather Goods
Perfumes & Cosmetics
Watches & Jewelry
Selective Retailing
Total LVMH
27 Q3 2022 revenue
Q1 2022
+ 2%
+ 30%
+ 17%
+ 19%
+ 24%
+ 23%
Q1 2021
+ 36%
+ 52%
+ 18%
+ 35%
- 5%
+ 30%
Q2 2022
+ 30%
+ 19%
+ 8%
+ 13%
+ 20%
+ 19%
Q2 2021
+ 55%
x 2,2
+ 67%
x 2,2
+ 31%
+ 84%
H1 2022
+ 14%
+ 24%
+ 13%
+ 16%
+ 22%
+ 21%
H1 2021
+ 44%
+ 81%
+ 37%
+ 71%
+ 12%
53%
Q3 2022
+ 14%
+ 22%
+ 10%
+ 16%
+ 15%
+ 19%
Q3 2021
+ 10%
+ 24%
+ 19%
+ 18%
+ 15%
+ 20%
9M 2022
+ 14%
+ 24%
+ 12%
+ 16%
+ 20%
+ 20%
9M 2021
+ 30%
+ 57%
+ 30%
+ 49%
+ 13%
40%
LVMHView entire presentation