Baird Investment Banking Pitch Book
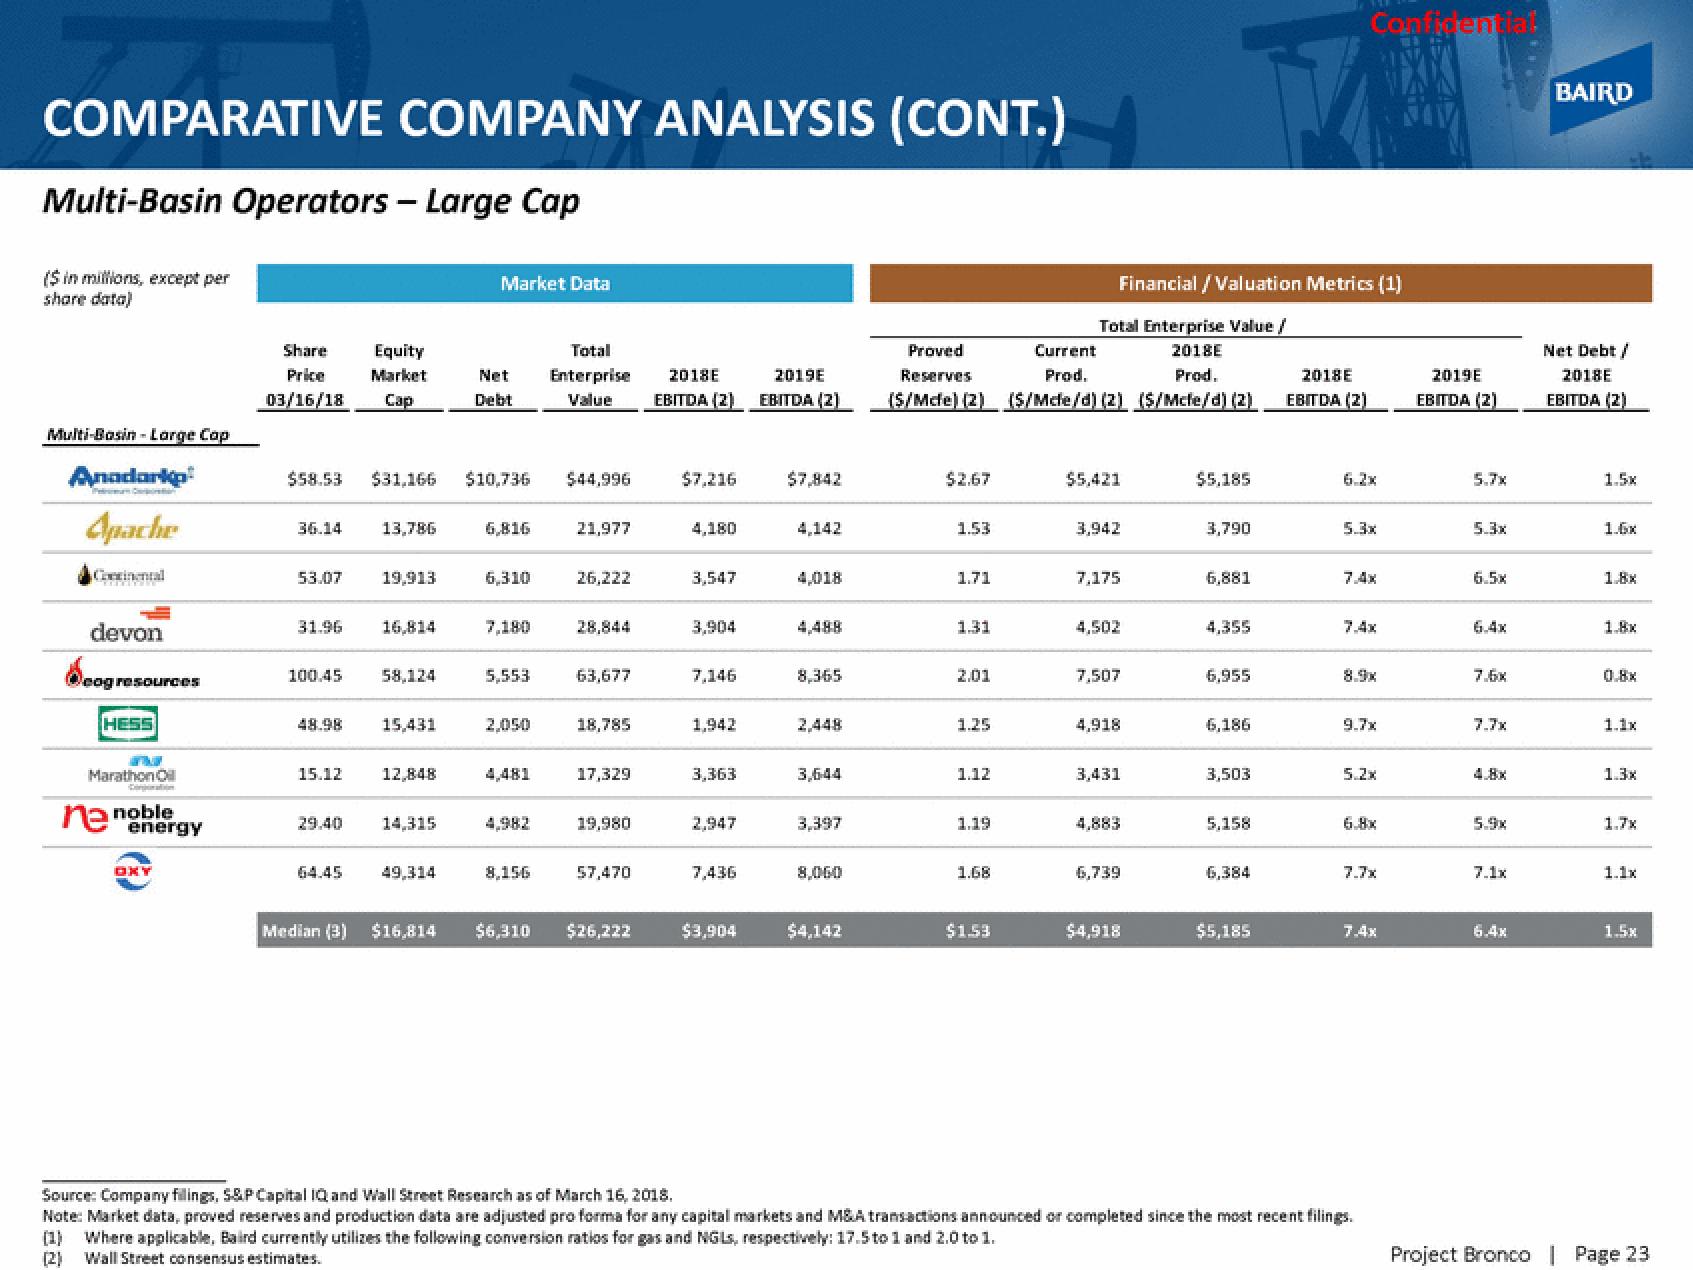
COMPARATIVE COMPANY ANALYSIS (CONT.)
Multi-Basin Operators - Large Cap
($ in millions, except per
share data)
Multi-Basin-Large Cap
Anadarko
Apache
Cerinental
devon
Deogresources
cog
HESS
Marathon Oil
ne noble
energy
OXY
Share
Price
03/16/18
36.14
53.07
$58.53 $31,166 $10,736
31.96
100.45
48.98
15.12
29.40
Equity
Market
Cap
64.45
13,786
19,913
16,814
58,124
15,431
12,848
14,315
Market Data
49,314
Total
Net Enterprise 2018E
Debt
6,816
6,310
7,180
5,553
2,050
4,481
4,982
8,156
2019E
Value EBITDA (2) EBITDA (2)
$44,996
21,977
26,222
28,844
63,677
18,785
17,329
19,980
57,470
Median (3) $16,814 $6,310 $26,222
$7,216
4,180
3,547
3,904
7,146
1,942
3,363
7,436
$3,904
$7,842
4,142
4,018
8,365
3,644
3,397
8,060
$4,142
Financial / Valuation Metrics (1)
Total Enterprise Value /
2018E
Proved
Current
Reserves
Prod.
(S/Mcle) (2) (S/Mcle/d) (2) (S/Mcle/d) (2)
Prod.
$2.67
1.53
1.71
1.31
2.01
1.25
1.12
1.19
1.68
$1.53
$5,421
3,942
7,175
4,502
7,507
4,918
3,431
4,883
6,739
$4,918
$5,185
3,790
6,881
4,355
6,955
6,186
3,503
5,158
6,384
$5,185
2018E
EBITDA (2)
Confidentiat
5.3x
7.4x
9.7x
5.2x
7.7x
7.4x
Source: Company filings, S&P Capital IQ and Wall Street Research as of March 16, 2018.
Note: Market data, proved reserves and production data are adjusted pro forma for any capital markets and M&A transactions announced or completed since the most recent filings.
(1) Where applicable, Baird currently utilizes the following conversion ratios for gas and NGLs, respectively: 17.5 to 1 and 2.0 to 1.
(2)
Wall Street consensus estimates.
2019E
EBITDA (2)
5.7x
5.3x
6.5x
6.4x
7.6x
7.7x
4.8x
5.9x
7.1x
6.4x
BAIRD
Net Debt /
2018F
EBITDA (2)
1.5x
1.6x
1.8x
0.8x
1.3x
1.7x
1.1x
1.5x
Project Bronco | Page 23View entire presentation