Telia Company Results Presentation Deck
LED markets
Lithuania
Reported currency, in SEK millions, like for like growth
781
811
+5.6%
840 841 862
368 368
+5.4%
404
370
401
Q1 21 Q2 21 Q3 21 Q4 21 Q1 22 Q1 21 Q2 21 Q3 21 Q4 21 Q1 22
Service revenues
EBITDA
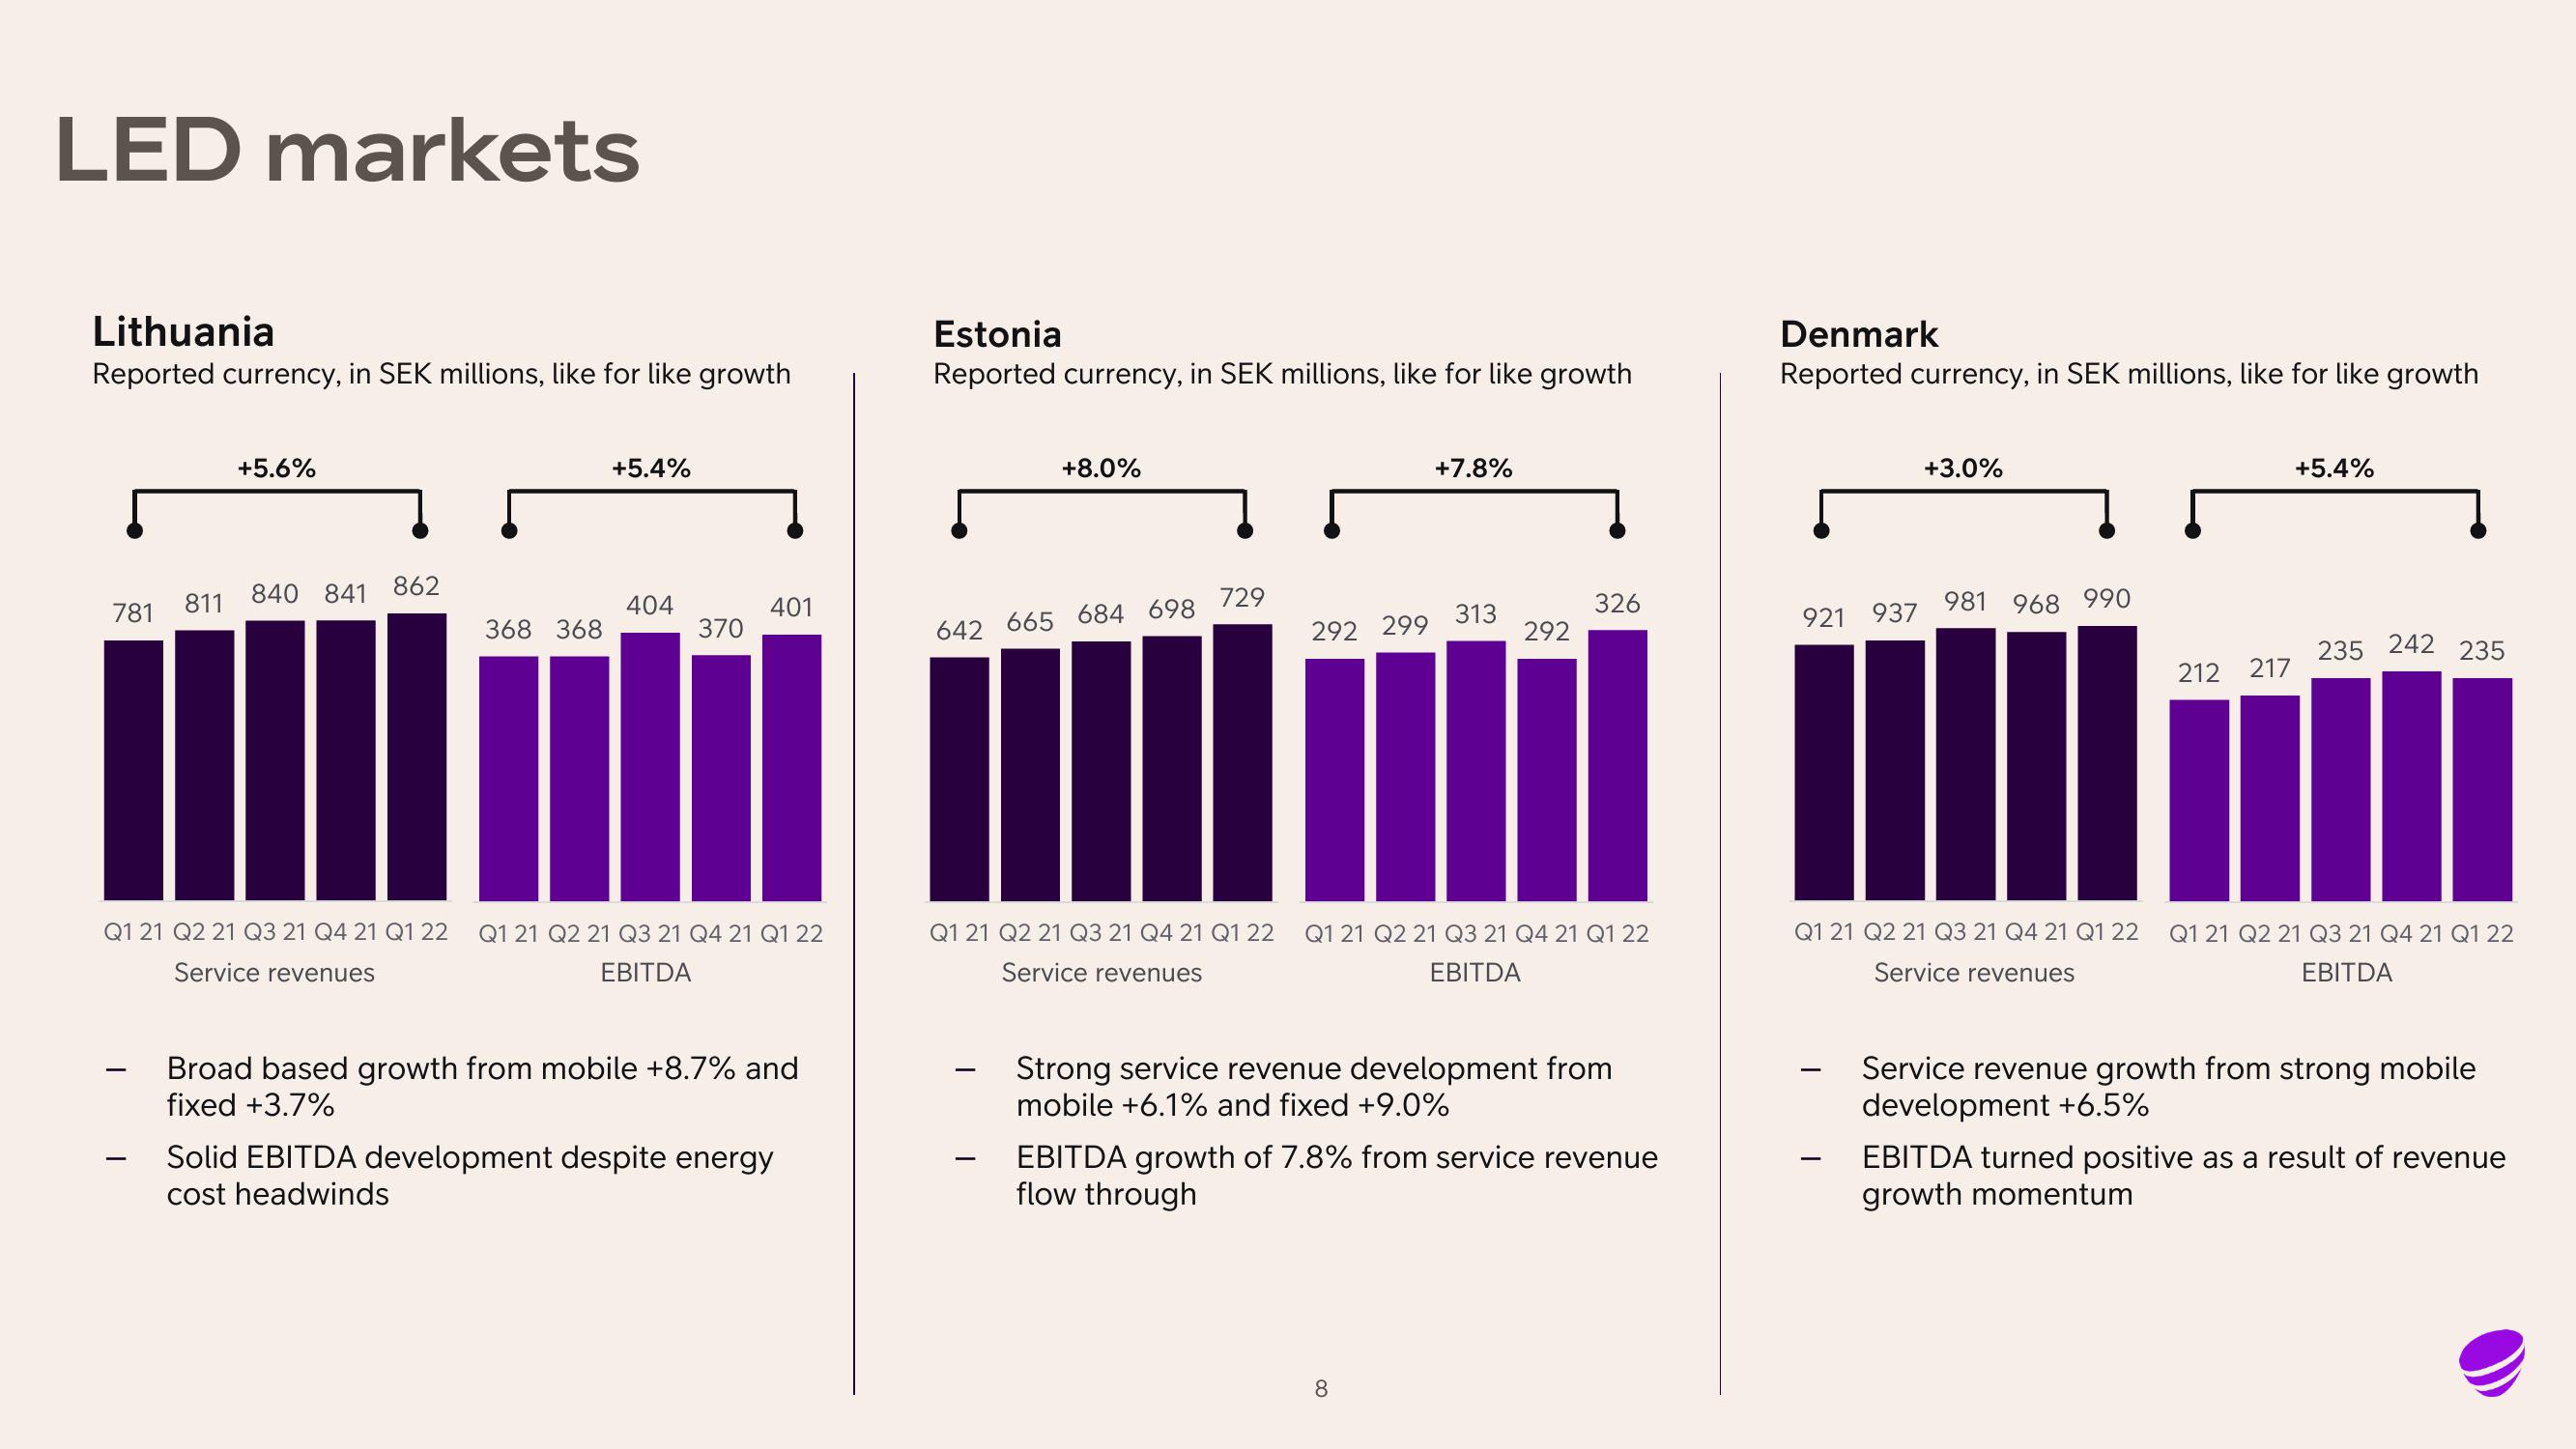
Broad based growth from mobile +8.7% and
fixed +3.7%
Solid EBITDA development despite energy
cost headwinds
Estonia
Reported currency, in SEK millions, like for like growth
+8.0%
642 665 684 698
729
292 299
+7.8%
313
292
8
326
Q1 21 Q2 21 Q3 21 Q4 21 Q1 22 Q1 21 Q2 21 Q3 21 Q4 21 Q1 22
Service revenues
EBITDA
Strong service revenue development from
mobile +6.1% and fixed +9.0%
EBITDA growth of 7.8% from service revenue
flow through
Denmark
Reported currency, in SEK millions, like for like growth
921 937
+3.0%
981
968 990
212 217
+5.4%
235 242 235
Q1 21 Q2 21 Q3 21 Q4 21 Q1 22 Q1 21 Q2 21 Q3 21 Q4 21 Q1 22
Service revenues
EBITDA
Service revenue growth from strong mobile
development +6.5%
EBITDA turned positive as a result of revenue
growth momentumView entire presentation