Evercore Investment Banking Pitch Book
Valuation Perpectives
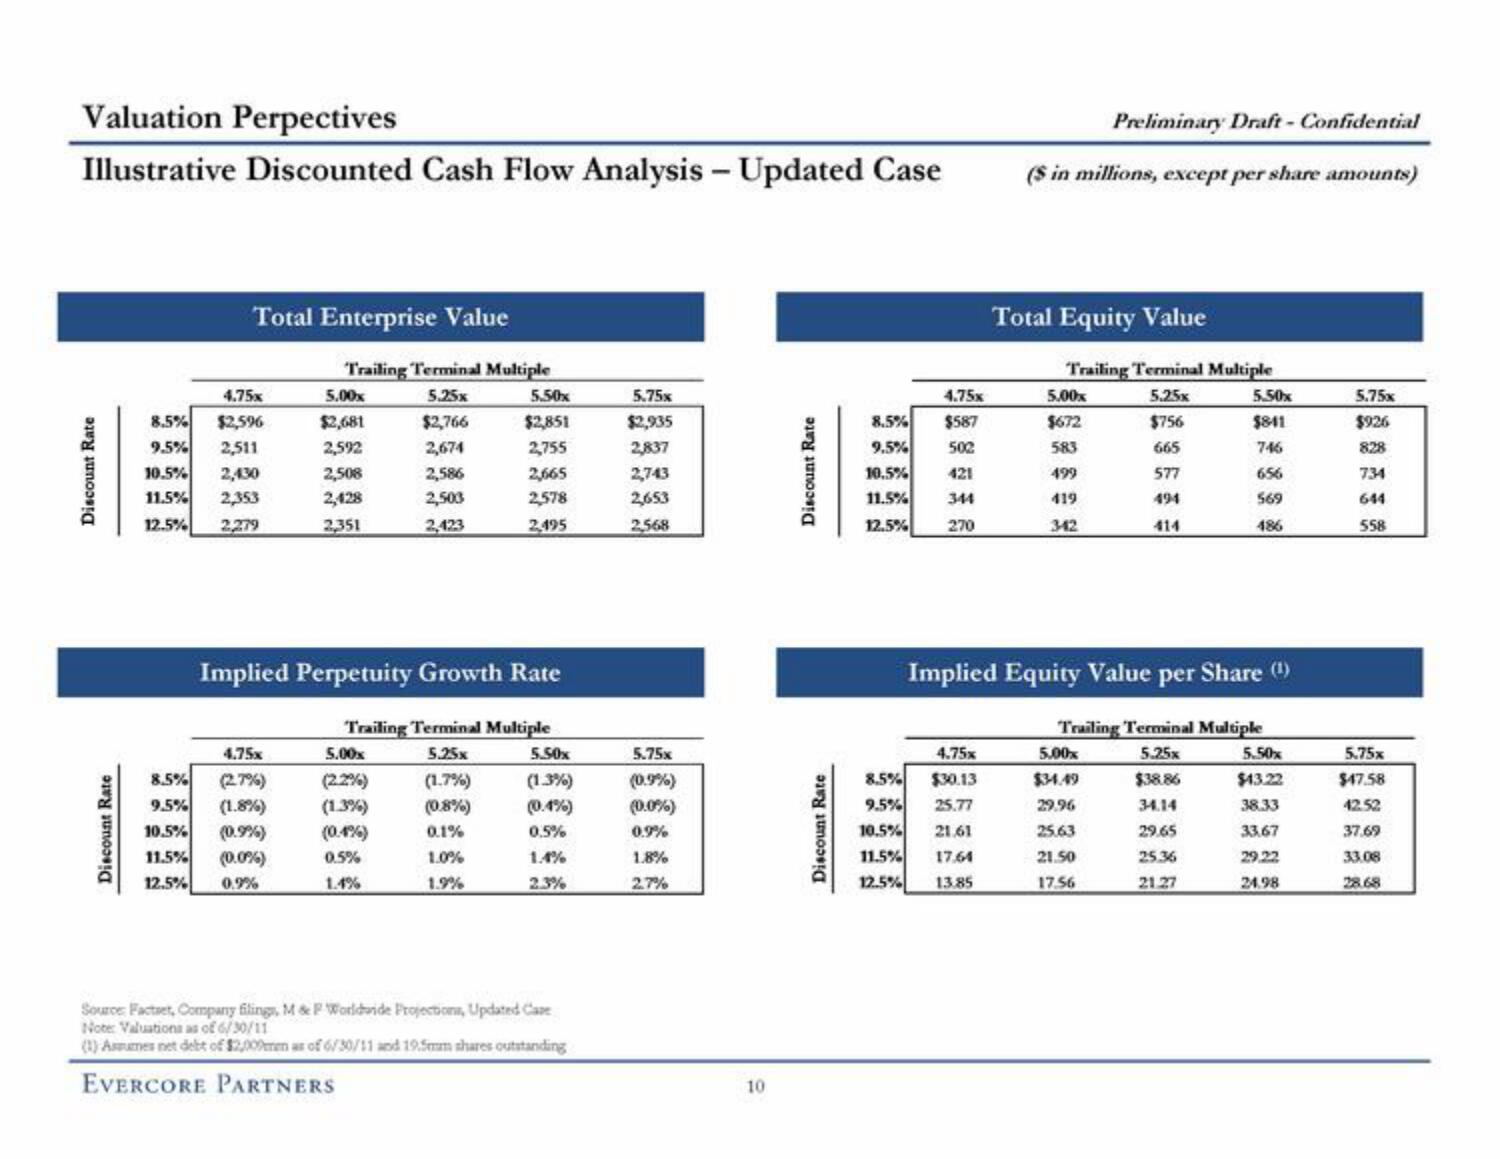
Illustrative Discounted Cash Flow Analysis - Updated Case
Discount Rate
Discount Rate
Total Enterprise Value
4.75x
8.5% $2,596
9.5% 2,511
10.5% 2,430
11.5% 2,353
12.5% 2,279
Trailing Terminal Multiple
5.25x
$2,766
2,674
2,586
2,503
2,423
4.75x
8.5% (2.7%)
9.5% (1.8%)
10.5%
(0.9%)
11.5%
(0.0%)
12.5% 0.9%
5.00x
$2,681
2,592
2,508
2,428
2,351
Implied Perpetuity Growth Rate
5.50x
$2,851
2,755
5.00x
(2.2%)
(1.3%)
(0.4%)
0.5%
1.4%
2,665
2,578
2,495
Trailing Terminal Multiple
5.25x
(1.7%)
(0.8%)
0.1%
1.0%
1.9%
5.50x
(1.3%)
(0.4%)
0.5%
1.4%
2.3%
Source Factaet, Company filings, M & F Worldwide Projections, Updated Case
Note: Valuations as of 6/30/11
(1) Assumes net debt of $2,000mm as of 6/30/11 and 19.5mm shares outstanding
EVERCORE PARTNERS
5.75%
$2,935
2,837
2,743
2,653
2,568
5.75x
(0.9%)
(0.0%)
0.9%
1.8%
2.7%
10
Discount Rate
Discount Rate
8.5%
9.5%
10.5%
11.5%
12.5%
4.75x
$587
502
421
344
270
Preliminary Draft - Confidential
($ in millions, except per share amounts)
4.75x
8.5%
$30.13
9.5% 25.77
10.5% 21.61
11.5%
17.64
12.5%
13.85
Total Equity Value
Trailing Terminal Multiple
5.25x
$756
665
577
494
414
5.00x
$672
583
499
419
342
Implied Equity Value per Share (¹)
Trailing Terminal Multiple
5.25x
5.00%
29.96
25.63
21.50
17.56
5.50x
$841
746
656
569
486
$38.86
34.14
29.65
25.36
21.27
5.50%
$43.22
38.33
33.67
29.22
24.98
5.75x
$926
828
734
644
558
5.75x
$47.58
42.52
37.69
33.08
28.68View entire presentation