Credit Suisse Investment Banking Pitch Book
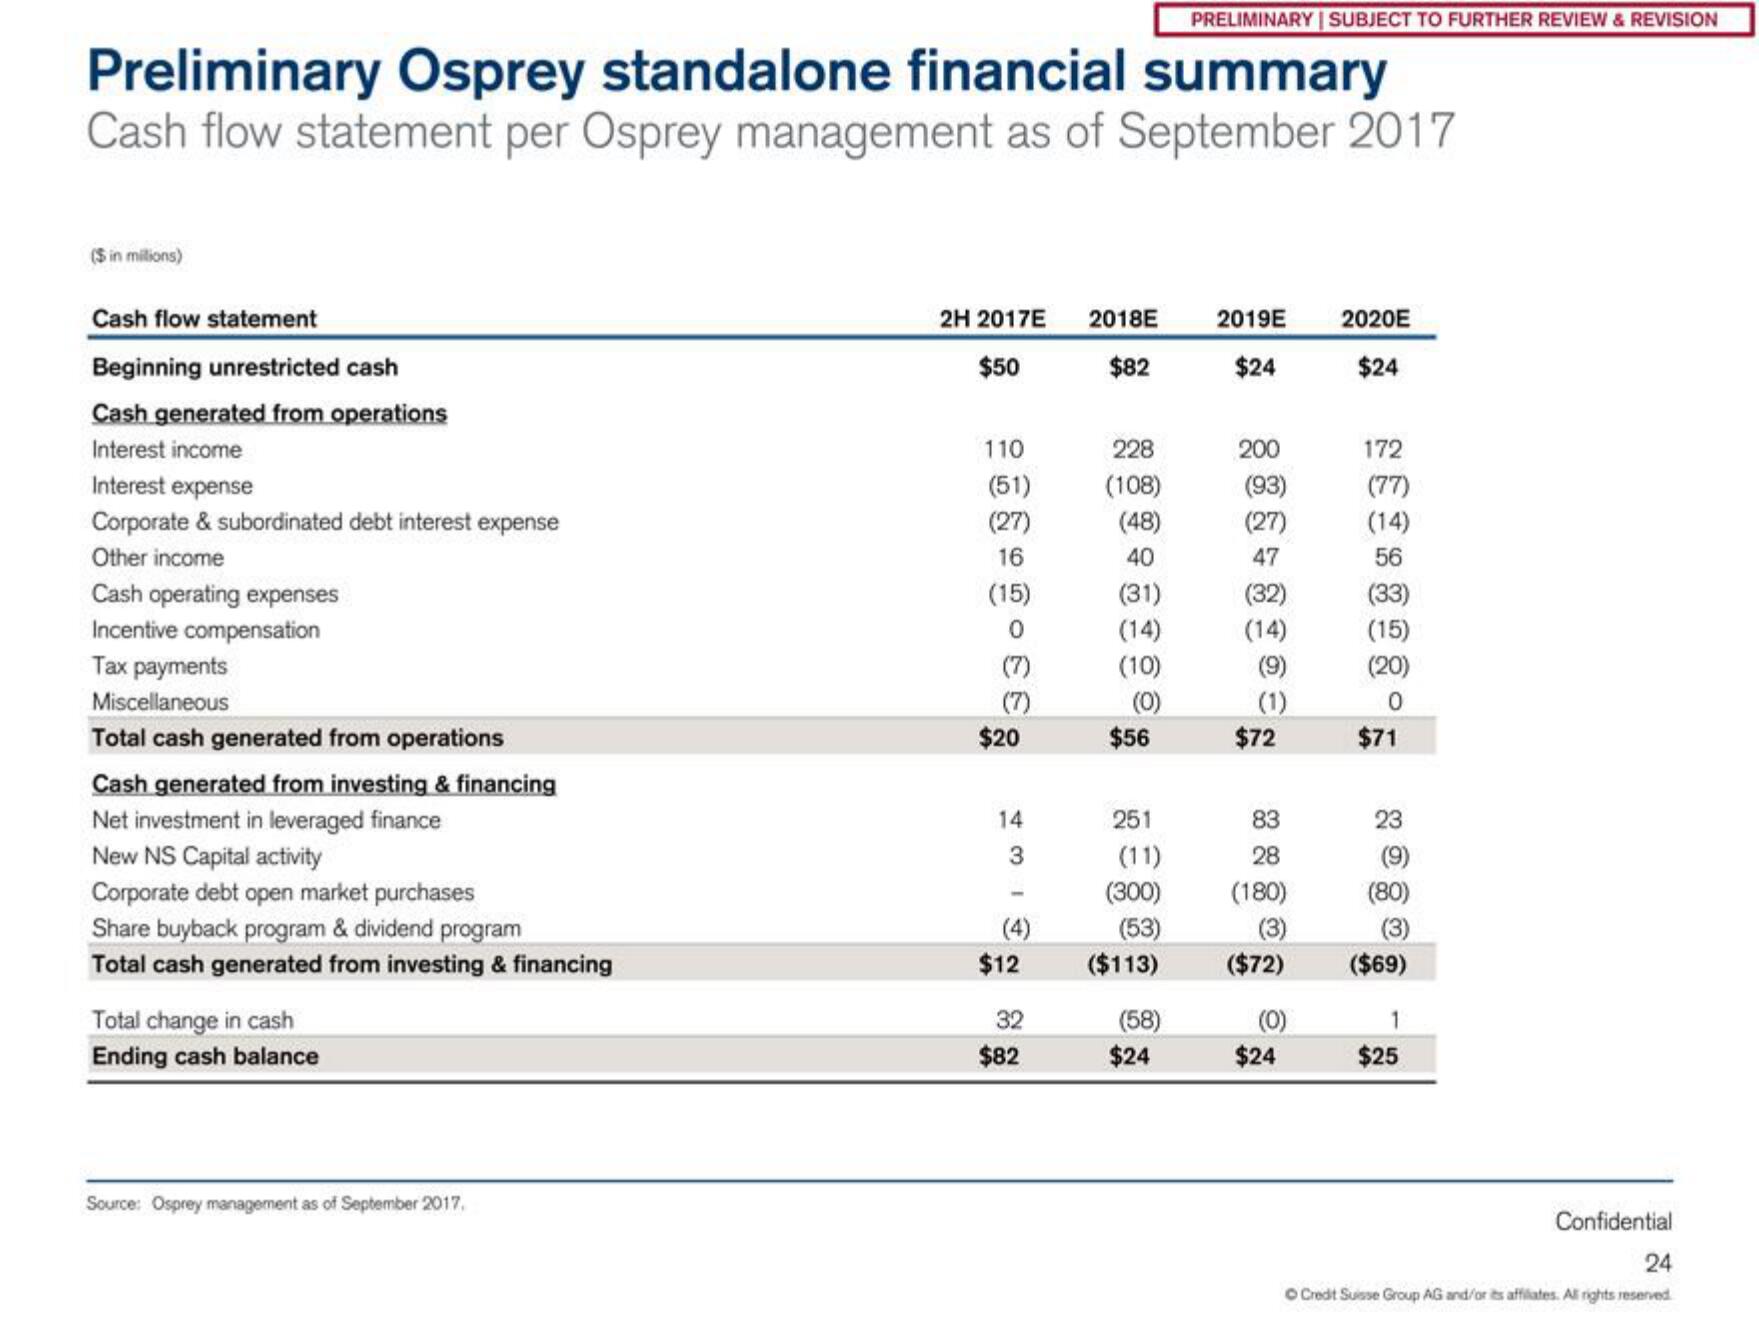
Preliminary Osprey standalone financial summary
Cash flow statement per Osprey management as of September 2017
($ in milions)
Cash flow statement
Beginning unrestricted cash
Cash generated from operations
Interest income
Interest expense
Corporate & subordinated debt interest expense
Other income
Cash operating expenses
Incentive compensation
Tax payments
Miscellaneous
Total cash generated from operations
Cash generated from investing & financing
Net investment in leveraged finance
New NS Capital activity
Corporate debt open market purchases
Share buyback program & dividend program
Total cash generated from investing & financing
Total change in cash
Ending cash balance
Source: Osprey management as of September 2017.
2H 2017E
$50
110
(51)
(27)
16
(15)
$20
14
3
(4)
$12
32
$82
2018E
$82
228
(108)
(48)
40
(31)
(14)
(10)
(0)
$56
251
(11)
(300)
(53)
($113)
(58)
PRELIMINARY | SUBJECT TO FURTHER REVIEW & REVISION
$24
2019E
$24
200
(93)
(27)
47
(32)
(14)
(9)
(1)
$72
83
28
(180)
(3)
($72)
(0)
$24
2020E
$24
172
(77)
(14)
56
(33)
(15)
(20)
0
$71
23
(9)
(80)
($69)
1
$25
Confidential
24
Credit Suisse Group AG and/or its affiliates. All rights reserved.View entire presentation